# Purchases - Annual summary
The **Purchases** tab presents **summaries related to expenses for goods and services**. It allows users to **control the structure of purchasing costs**, **monitor their dynamics over time, and assess which suppliers have the largest share in the company’s total purchases.**
With the analyses available in this tab, users can:
\- **review the value of purchases over time** – for example, monthly or annually,
\- **compare expenses across different product groups**,
\- **analyze purchases by suppliers** – to identify key business partners,
\- **verify the share of individual warehouses in total purchases**,
\- **assess the contribution of countries or regions** from which deliveries are made.
The **Purchases** tab enables ongoing **monitoring of how procurement costs evolve**, where the largest expenses occur, and how the purchase structure looks in terms of suppliers, products, and locations.
Thanks to this, users gain a comprehensive view of which purchases are critical to the company’s operations and which may require cost optimization.
All values are calculated based on purchase documents (PZ, P-).
### Purchase value in the year
[](https://help.cairo.pl/uploads/images/gallery/2026-04/CZuCIUgUnPMQEoU9-image.png)
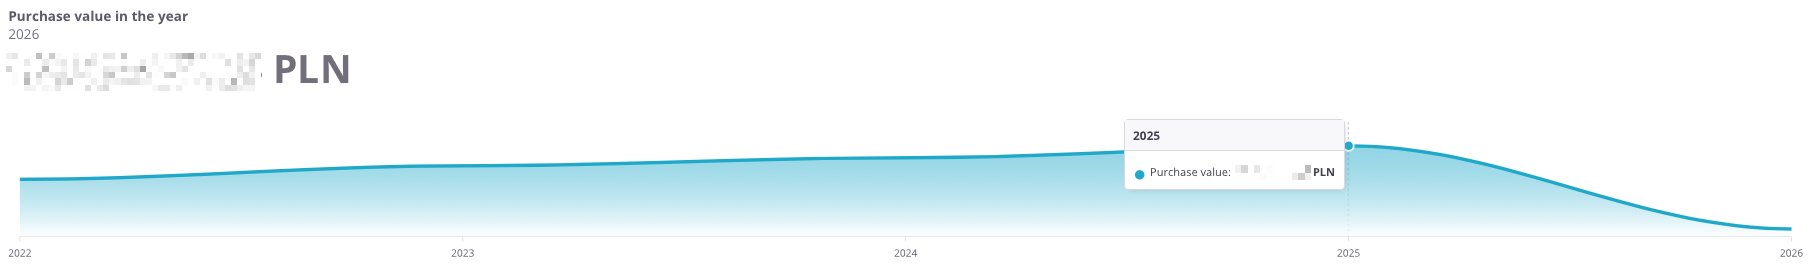
**“Purchase value in the year”** – the chart presents the **annual value of the company’s purchases**. It allows users to analyze how **purchase costs have evolved over the years** and determine whether they show an **upward or downward trend**.
The chart displays:
- **Purchase value in a given year** – total expenditure on purchases during the selected period,
- **Timeline axis** – enabling year-to-year comparison of data.
Thanks to this chart, users can easily identify **trends in purchasing costs** and assess whether **expenses remain stable** or are subject to **greater fluctuations**.
---
### Purchases by years
[](https://help.cairo.pl/uploads/images/gallery/2026-04/nAg2aBAomo5JbxJl-image.png)
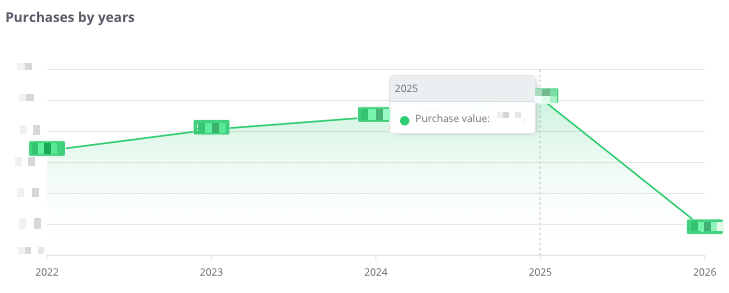
**“Purchases by years”** – the chart presents the **total value of purchases on an annual basis**, allowing the analysis of the company’s spending dynamics over recent years.
The chart shows:
- **purchase values by year** – the total amount spent on goods and services,
- **timeline axis** – enabling year-to-year comparison of changes,
- **purchase trend line** – illustrating increases or decreases in costs over the years.
Thanks to this chart, users can easily assess whether the company’s purchase expenses are **rising, declining, or remaining stable**, providing a solid foundation for **further cost analysis and budget planning**.
---
### **Purchases by years – table**
[](https://help.cairo.pl/uploads/images/gallery/2026-04/SQtvnd6Y75Jq5D44-image.png)
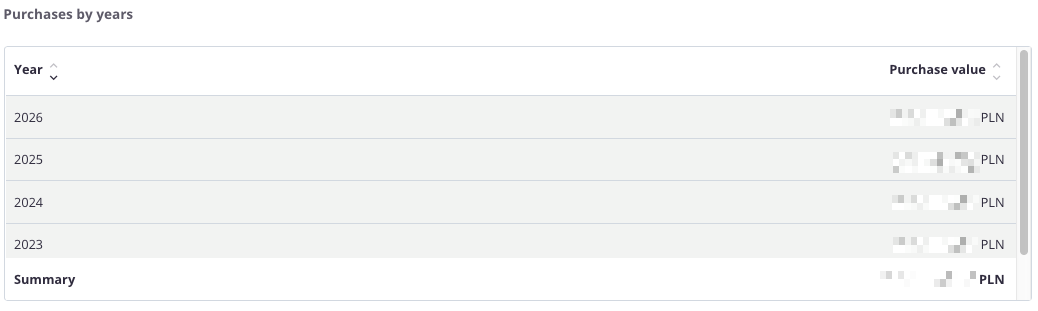
**“Purchases by years – table”** – the table presents the **value of purchases for each year**, allowing users to review how purchasing costs have changed over time and what the total amount was over a longer period.
The table includes the following fields:
- **Year** – the period to which the data applies,
- **Purchase value** – the total amount of all purchases made in a given year.
The table features a **search field** that allows users to narrow the data to selected years. In such cases, **the summaries automatically adjust** to display totals only for the filtered results.
Additionally, data can be **sorted by clicking column headers** – for example, to arrange years in ascending or descending order based on purchase value.
Thanks to this table, users can **quickly analyze changes in purchasing costs over the years** and assess whether expenditures show an **upward or downward trend**.
---