# Purchases - Purchases by contractors
All values are calculated based on purchase documents (PZ, P-).
---
[](https://help.cairo.pl/uploads/images/gallery/2026-04/fm1JuwXzYBBjjD6C-image.png)
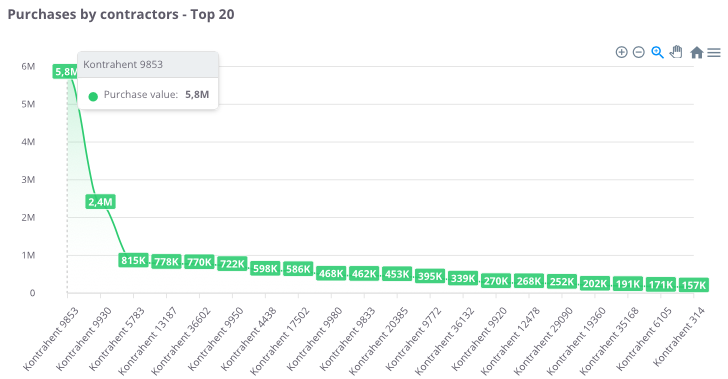
**“Purchases by contractors – Top 20”** – the chart presents the **20 contractors with the highest purchase value**. It allows users to identify **which suppliers play a key role in the company’s purchasing structure**.
The chart displays:
- **Purchase value (green)** – total expenditure with each contractor,
- **X-axis** – individual contractors,
- **Y-axis** – purchase values.
Thanks to this chart, users can easily assess **which contractors generate the highest purchasing costs** and compare **how spending is distributed among the company’s main suppliers**.
---
### Purchases by contractors – Top 100
[](https://help.cairo.pl/uploads/images/gallery/2026-04/qakUnOKEP6WcwY4x-image.png)
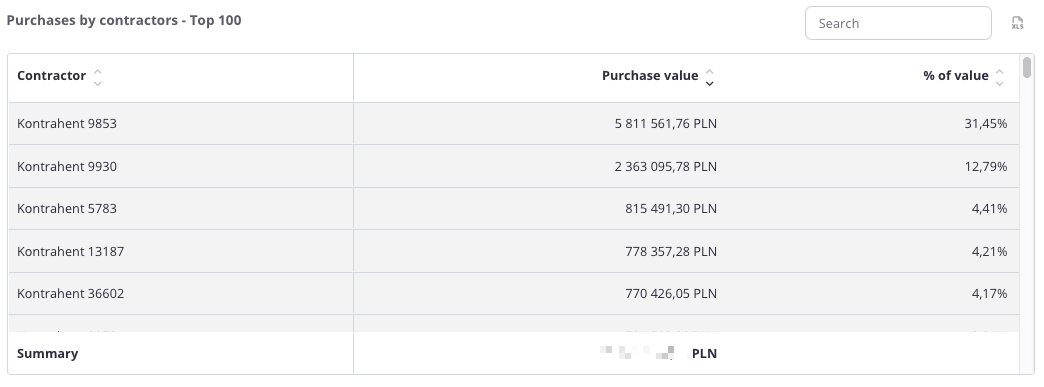
**“Purchases by contractors – Top 100”** – the table presents a **summary of contractors with the highest purchase values**. It allows users to identify **which suppliers account for the largest share of company expenses** and how the **purchase structure** is distributed.
The table includes the following fields:
- **Contractor** – name of the contractor,
- **Purchase value** – total expenditure with the given contractor,
- **% of Value** – the contractor’s percentage share in total purchase value.
The table includes a **search field**, allowing users to narrow the data to selected contractors. In such cases, **summaries automatically adjust** to the filtered results.
Additionally, data can be **sorted by clicking column headers** – for example, to arrange contractors by **purchase value** **or percentage share**.
Thanks to this table, users can easily identify the **company’s key suppliers** and understand **their share in overall purchasing costs**.
---