# Purchases - Purchases by countries
All values are calculated based on purchase documents (PZ, P-).
---
**“Purchases by country”** – the chart presents the **share of purchases broken down by countries** from which goods and services originate. It allows users to see **in which markets the company incurs the highest purchasing costs**.
The chart displays:
- **countries of purchase** – each country is marked with a different color,
- **percentage share** – showing what portion of total purchase value each country represents.
Thanks to this chart, users can easily identify **which country dominates the purchase structure** and which markets play a **smaller role**.
---
### Purchases by country – table
[](https://help.cairo.pl/uploads/images/gallery/2026-04/usBGEPm754muAAbu-image.png)
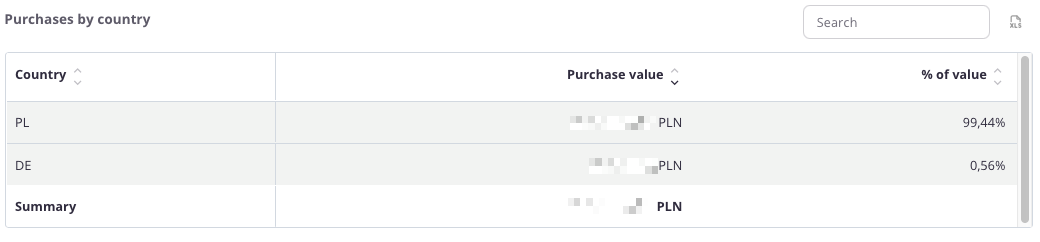
**“Purchases by country – table”** – the table presents the **value of purchases broken down by countries**. It allows users to determine **which markets have the largest share in the company’s purchasing structure**.
The table includes the following fields:
- **Country** – name of the country,
- **Purchase value** – total expenditure on purchases made in that country,
- **% Value** – percentage share of the country in total company purchases.
The table includes a **search field**, allowing users to narrow the data to selected countries. In such cases, **summaries automatically adjust** to the filtered results.
Additionally, data can be **sorted by clicking column headers** – for example, to arrange countries by **purchase value** or **percentage share**.
Thanks to this table, users can easily assess **which markets dominate the purchase structure** and which ones have **marginal significance**.
---