All values are calculated based on sales documents (DD, WZ (which were not created as a result of conversion from DD), PG, GP, ZW).
All values are converted to PLN according to the exchange rate of the previous day, ensuring a consistent presentation regardless of the document currency.
--- ### **Sales by GDH – Top 20** [ ](https://help.cairo.pl/uploads/images/gallery/2025-10/MlyFr8BFDxXcIsrX-image.png) [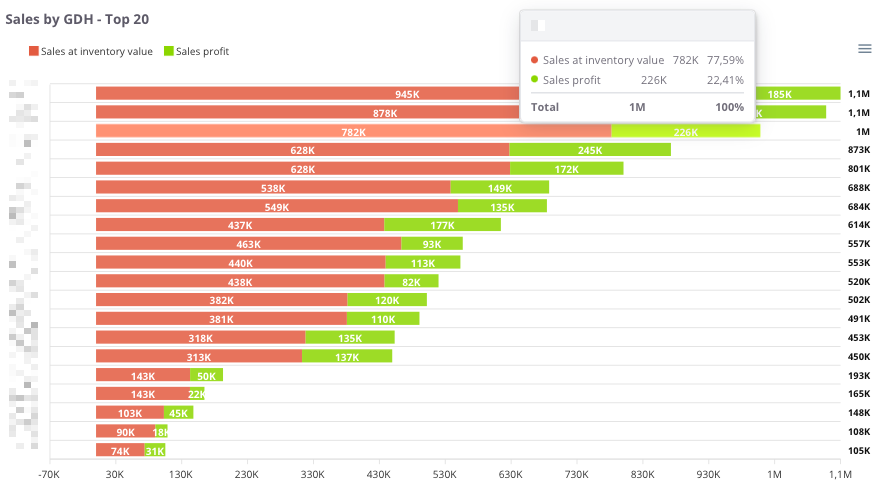](https://help.cairo.pl/uploads/images/gallery/2026-04/AIpzEc9tgNGDW8HL-image.png) **“Sales by GDH – Top 20”** – the chart presents the **20 main trade groups (GDH)**, showing both the **recorded sales value** and the **sales profit**. This allows users to assess **which groups generate the highest revenue** and what their **profitability levels** are. The chart displays: - **Recorded sales (red)** – the sales value assigned to a given trade group, - **Sales profit (green)** – the financial result achieved within that group, - **X-axis** – sales and profit values, - **Y-axis** – individual trade groups (GDH). Thanks to this chart, users can easily compare **which trade groups generate the highest turnover** and determine **whether high sales translate into proportional profit**. --- ### **Sales by GDH – table** [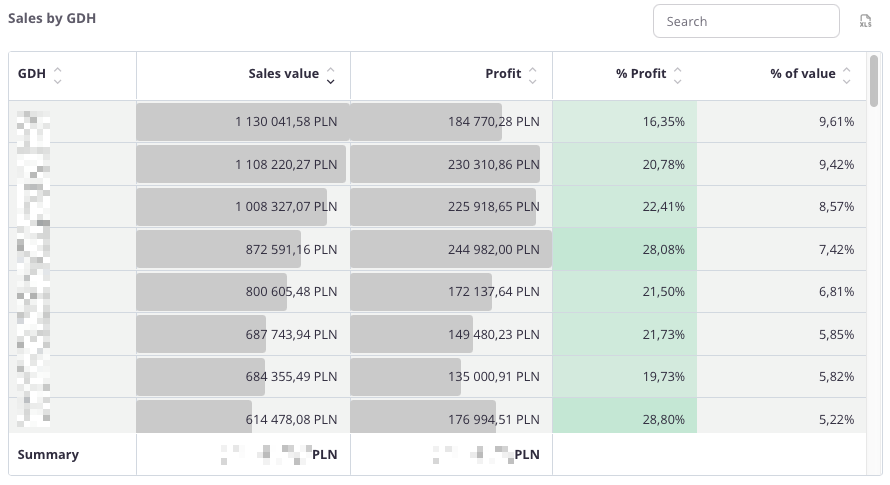](https://help.cairo.pl/uploads/images/gallery/2026-04/tTYjImxprR292Rf4-image.png) **“Sales by GDH – table”** – the table presents **sales data broken down by trade groups (GDH)**. It allows users to identify **which groups generate the highest sales and profit** and assess **their share in the company’s total sales structure**. The table includes the following fields: - **GDH** – trade group identifier, - **Sales value** – total sales assigned to the group, - **Profit** – financial result achieved within that group, - **% Profit** – percentage share of profit in total sales value, - **% Value** – percentage share of the trade group in the company’s total sales. The table uses **color highlighting**: - **Green** – the more intense the color, the higher the percentage of profit, - **Red** – indicates negative values, representing a loss. The table includes a **search field**, allowing users to narrow the data to selected trade groups. In such cases, **summaries automatically adjust** to the filtered results. Additionally, data can be **sorted by clicking column headers** – for example, to arrange groups by **sales value**, **profit**, or **profitability**. Thanks to this, users can easily identify **the most important trade groups** and evaluate **their impact on the company’s sales and profitability**.