All values are calculated based on sales documents (WZ, PG, GP, ZW).
All values are converted to PLN according to the exchange rate of the previous day, ensuring consistent presentation regardless of the document currency.
--- ### Sales by contractors [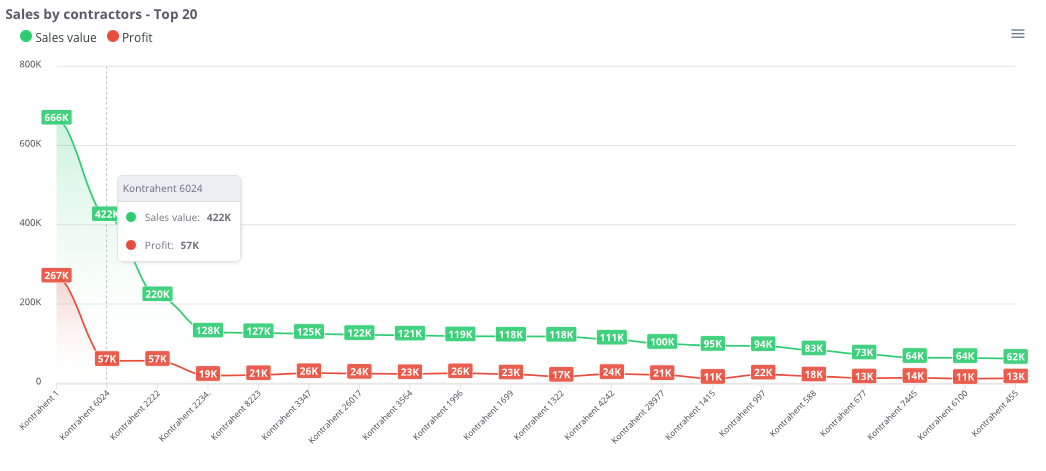](https://help.cairo.pl/uploads/images/gallery/2026-03/hjUnrnIAAWWSQWwV-image.png) **“Sales by contractors – Top 20”** – the chart presents the **20 contractors with the highest sales value**, along with their corresponding profit. This makes it possible to quickly identify **key clients** and understand their **importance within the company’s revenue structure**. The chart displays: - **Sales value (green)** – total sales made for each contractor, - **Profit (red)** – financial result achieved from cooperation with each contractor, - **X-axis** – list of contractors, - **Y-axis** – sales and profit values. Thanks to this chart, users can easily compare **which contractors generate the highest revenue and profit**, as well as assess **the gap between sales and profitability** in relationships with individual clients. --- ### Sales by contractors - Top 500 [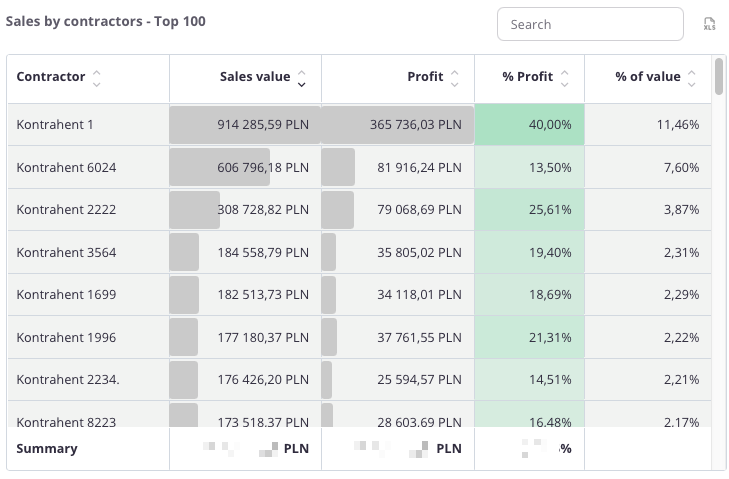](https://help.cairo.pl/uploads/images/gallery/2026-04/s7yFbGjJwo9m4IfD-image.png) **“Sales by contractors – Top 500”** – the table presents a **list of contractors with the highest sales value**, along with the corresponding profit. This allows for a detailed analysis of **which clients have the greatest impact on the company’s revenue and profitability**. The table includes the following fields: - **Contractor** – name of the contractor, - **Sales** – total sales value for the given client, - **Profit** – financial result achieved from cooperation, - **% Profit** – percentage share of profit in total sales, - **% Value** – percentage share of the contractor in total company sales. The table uses **color highlighting**: - **Green** – the more intense the color, the higher the profit percentage, - **Red** – would indicate negative values, representing a loss. The table includes a **search field**, allowing data to be narrowed to selected contractors. In such cases, **summaries automatically adjust** to the filtered results. Additionally, data can be **sorted by clicking column headers** – for example, to arrange contractors by **sales value**, **profit**, or **profitability**. Thanks to this, users can easily identify the **most important clients** and assess **how significantly they influence the company’s overall sales and profit**. ---