# Sales - Sales by routes

<p class="callout info">All values are calculated based on sales documents (WZ, PG, GP, ZW).</p>

<p class="callout info">All values are converted to PLN according to the exchange rate of the previous day, ensuring consistent presentation regardless of the document currency.</p>

---

### Sales by routes

[![image.png](https://help.cairo.pl/uploads/images/gallery/2026-04/scaled-1680-/Z0YbQQFvPapn8ytB-image.png)
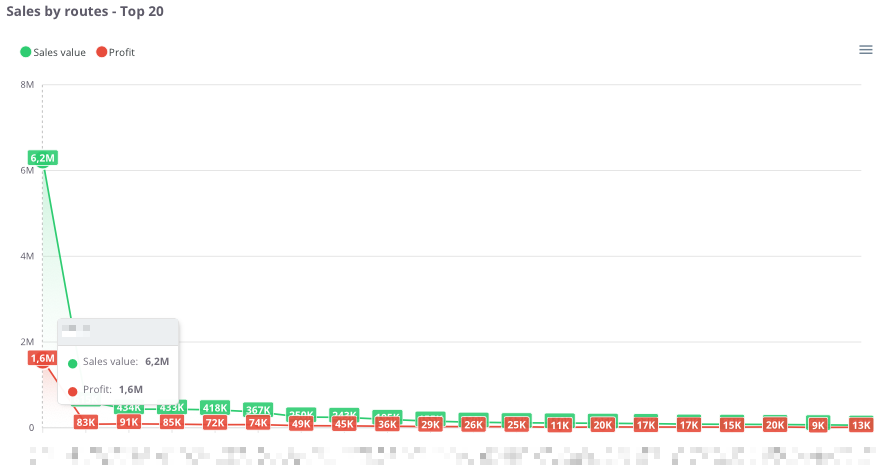
](https://help.cairo.pl/uploads/images/gallery/2026-04/Z0YbQQFvPapn8ytB-image.png)

<article class="text-token-text-primary w-full focus:outline-none scroll-mt-[calc(var(--header-height)+min(200px,max(70px,20svh)))]" data-scroll-anchor="true" data-testid="conversation-turn-439" data-turn="assistant" data-turn-id="request-68d24bac-c560-832f-9269-08a13185b5ab-62" dir="auto" id="bkmrk-%E2%80%9Csales-by-routes-%E2%80%93-t" tabindex="-1">**“Sales by routes – Top 20”** – the chart presents the **20 routes with the highest sales value**, along with the corresponding profit. This makes it possible to identify **which routes are the most profitable** and how their **profitability levels** compare.

The chart displays:

<div class="text-base my-auto mx-auto pb-10 [--thread-content-margin:--spacing(4)] thread-sm:[--thread-content-margin:--spacing(6)] thread-lg:[--thread-content-margin:--spacing(16)] px-(--thread-content-margin)"><div class="[--thread-content-max-width:40rem] thread-lg:[--thread-content-max-width:48rem] mx-auto max-w-(--thread-content-max-width) flex-1 group/turn-messages focus-visible:outline-hidden relative flex w-full min-w-0 flex-col agent-turn" tabindex="-1"><div class="flex max-w-full flex-col grow"><div class="min-h-8 text-message relative flex w-full flex-col items-end gap-2 text-start break-words whitespace-normal [.text-message+&]:mt-5" data-message-author-role="assistant" data-message-id="0413369d-6c79-4118-a36b-1207b8334660" data-message-model-slug="gpt-5" dir="auto"><div class="flex w-full flex-col gap-1 empty:hidden first:pt-[1px]"><div class="markdown prose dark:prose-invert w-full break-words dark markdown-new-styling">- **Sales value <span style="color: rgb(45, 194, 107);">(green)</span>** – total sales assigned to the route,
- **Profit (<span style="color: rgb(224, 62, 45);">red</span>)** – financial result generated from sales on that route,
- **X-axis** – individual routes,
- **Y-axis** – sales and profit values.

</div></div></div></div></div></div>Thanks to this chart, users can easily compare **which routes generate the highest revenue**, as well as assess **whether the profit share is proportional to the sales value**.

</article>---

### **Sales by routes - table**

[![image.png](https://help.cairo.pl/uploads/images/gallery/2026-04/scaled-1680-/p4qa4Mlvuiynb5Gf-image.png)](https://help.cairo.pl/uploads/images/gallery/2026-04/p4qa4Mlvuiynb5Gf-image.png)

<article class="text-token-text-primary w-full focus:outline-none scroll-mt-[calc(var(--header-height)+min(200px,max(70px,20svh)))]" data-scroll-anchor="true" data-testid="conversation-turn-441" data-turn="assistant" data-turn-id="request-68d24bac-c560-832f-9269-08a13185b5ab-63" dir="auto" id="bkmrk-%E2%80%9Csales-by-routes-%E2%80%93-t-1" tabindex="-1">**“Sales by routes – table”** – this summary presents **sales data broken down by individual routes**. It allows users to identify which routes generate the **highest revenue and profit**, as well as assess their **share in total company sales**.

The table includes the following fields:

<div class="text-base my-auto mx-auto pb-10 [--thread-content-margin:--spacing(4)] thread-sm:[--thread-content-margin:--spacing(6)] thread-lg:[--thread-content-margin:--spacing(16)] px-(--thread-content-margin)"><div class="[--thread-content-max-width:40rem] thread-lg:[--thread-content-max-width:48rem] mx-auto max-w-(--thread-content-max-width) flex-1 group/turn-messages focus-visible:outline-hidden relative flex w-full min-w-0 flex-col agent-turn" tabindex="-1"><div class="flex max-w-full flex-col grow"><div class="min-h-8 text-message relative flex w-full flex-col items-end gap-2 text-start break-words whitespace-normal [.text-message+&]:mt-5" data-message-author-role="assistant" data-message-id="b6e4c0bc-e506-4266-876a-8ea4a82d3fa4" data-message-model-slug="gpt-5" dir="auto"><div class="flex w-full flex-col gap-1 empty:hidden first:pt-[1px]"><div class="markdown prose dark:prose-invert w-full break-words dark markdown-new-styling">- **Route** – route identifier,
- **Sales value** – total sales made on the route,
- **Profit** – financial result generated by sales on that route,
- **% Profit** – percentage share of profit in total sales value,
- **% Value** – percentage share of the route in total company sales.

</div></div></div></div></div></div>The table uses **color highlighting**:

<div class="text-base my-auto mx-auto pb-10 [--thread-content-margin:--spacing(4)] thread-sm:[--thread-content-margin:--spacing(6)] thread-lg:[--thread-content-margin:--spacing(16)] px-(--thread-content-margin)"><div class="[--thread-content-max-width:40rem] thread-lg:[--thread-content-max-width:48rem] mx-auto max-w-(--thread-content-max-width) flex-1 group/turn-messages focus-visible:outline-hidden relative flex w-full min-w-0 flex-col agent-turn" tabindex="-1"><div class="flex max-w-full flex-col grow"><div class="min-h-8 text-message relative flex w-full flex-col items-end gap-2 text-start break-words whitespace-normal [.text-message+&]:mt-5" data-message-author-role="assistant" data-message-id="b6e4c0bc-e506-4266-876a-8ea4a82d3fa4" data-message-model-slug="gpt-5" dir="auto"><div class="flex w-full flex-col gap-1 empty:hidden first:pt-[1px]"><div class="markdown prose dark:prose-invert w-full break-words dark markdown-new-styling">- <span style="color: rgb(45, 194, 107);">**Green** </span>– the more intense the color, the higher the profitability (% profit share),
- <span style="color: rgb(224, 62, 45);">**Red** </span>– indicates negative values, representing a loss.

</div></div></div></div></div></div>The table includes a **search field**, allowing users to narrow the data to selected routes. In such cases, **summaries automatically adjust** to the filtered results.

Additionally, data can be **sorted by clicking column headers** – for example, to arrange routes by **sales value**, **profit**, or **profitability**.

Thanks to this, users can easily identify the **most profitable routes** and understand their **importance within the company’s overall sales structure**.

</article>---