# Settlements - Payment terms
All values are converted to PLN according to the **exchange rate of the previous day**, ensuring consistent presentation regardless of the document currency.
[](https://help.cairo.pl/uploads/images/gallery/2026-04/d0V6YxEImURHOCaB-image.png)
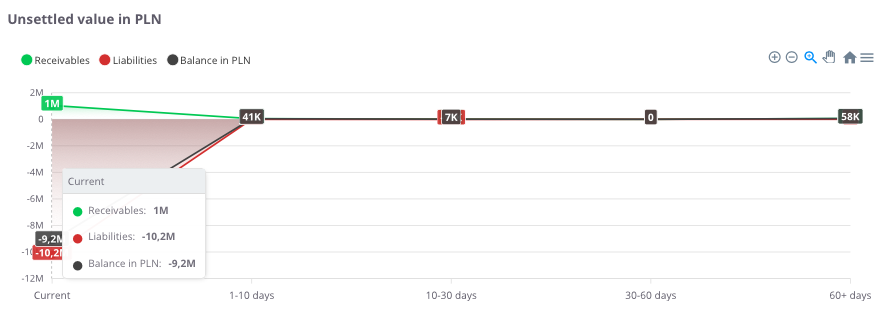
**“Unsettled value in PLN”** – the chart presents **outstanding settlements over time**, broken down by **overdue periods**. This makes it possible to see how the structure of receivables and liabilities changes across different time intervals.
The chart displays:
- **Receivables (**green**)** – amounts expected from contractors that have not yet been settled,
- **Liabilities (**red**)** – amounts the company should pay to suppliers,
- **Balance in PLN (black)** – the difference between receivables and liabilities within a given overdue period.
Thanks to this chart, the user can quickly identify whether the company faces a greater issue with **delayed payments from customers (receivables)** or with **its own overdue liabilities**.
---
[](https://help.cairo.pl/uploads/images/gallery/2026-03/BFLfY7po8ztXvn5m-image.png)
**
**
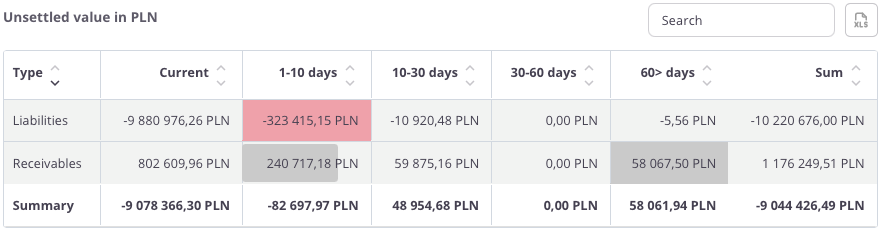
**“Unsettled value in PLN – table”** – this summary presents **outstanding receivables and liabilities** broken down by **overdue periods**. For each category, the following values are displayed:
- **Current** – settlements for which the payment term has not yet expired,
- **1–10 days** – settlements overdue by up to 10 days,
- **10–30 days** – settlements overdue between 10 and 30 days,
- **30–60 days** – settlements overdue between 30 and 60 days,
- **60> days** – settlements overdue by more than 60 days,
- **Total** – the overall value of receivables and liabilities.
The table uses **color highlighting**:
- **Red bar** – its length reflects the volume of liabilities; the longer the bar, the higher the total amount payable.
- **Grey bar** – its length corresponds to the volume of receivables; the longer the bar, the higher the total amount due.
Thanks to this, the user can easily identify **which time ranges show the largest payment delays** and understand **the proportions between receivables and liabilities**.
The table includes a **search field** that allows narrowing the data to selected records. In such cases, **summaries automatically adjust** to the filtered results.
Additionally, data can be **sorted by clicking column headers** – for example, to arrange settlements according to values within a selected time range.
---
### Liabilities value in PLN
[](https://help.cairo.pl/uploads/images/gallery/2026-04/8EWzQdIWdXNHCgMH-image.png)
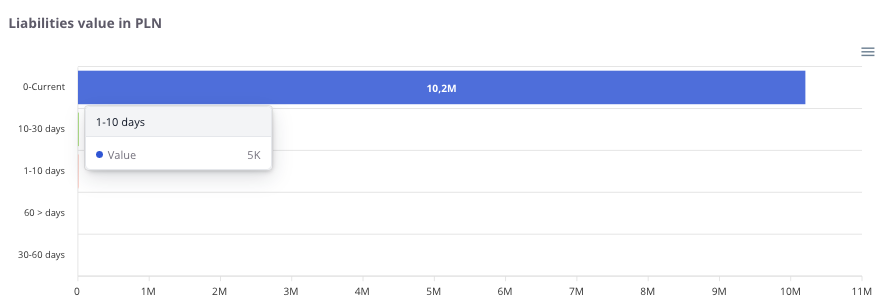
**“Liabilities value in PLN”** – the chart presents the company’s **liabilities broken down by overdue periods**. It allows users to check which portion of liabilities is current and which requires immediate attention.
The chart displays:
- **Current** – liabilities for which the payment due date has not yet passed,
- **1–10 days** – liabilities overdue by up to 10 days,
- **10–30 days** – liabilities overdue between 10 and 30 days,
- **30–60 days** – liabilities overdue between 30 and 60 days,
- **60> days** – liabilities overdue by more than 60 days (the most risky portion of the liabilities portfolio).
Thanks to this, the user can quickly assess **where the company’s largest financial burden is concentrated** and take appropriate actions to **improve liquidity**.
---
### Receivables value in PLN
[](https://help.cairo.pl/uploads/images/gallery/2026-04/ARVLld33ufPBe4rY-image.png)
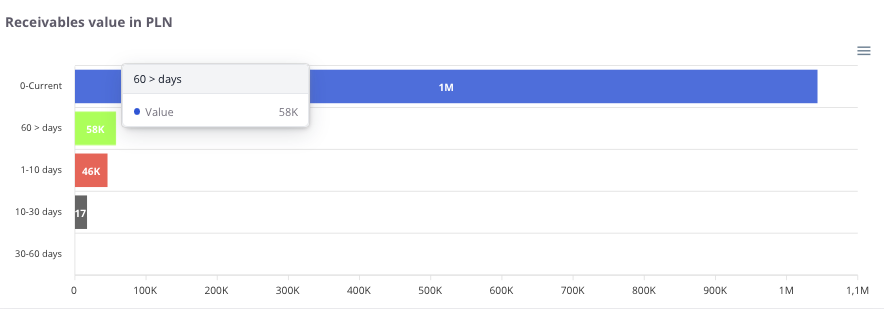
**“Receivables value in PLN”** – the chart presents the company’s **receivables broken down by overdue periods**. It allows users to check which portion of receivables is current and which is already past due.
The chart displays:
- **Current** – receivables for which the payment due date has not yet passed,
- **1–10 days** – receivables overdue by up to 10 days,
- **10–30 days** – receivables overdue between 10 and 30 days,
- **30–60 days** – receivables overdue between 30 and 60 days,
- **60> days** – receivables overdue by more than 60 days (the most risky portion of the receivables portfolio).
Thanks to this, the user can easily assess **which receivables require urgent collection actions** and what is the **risk of delays in incoming payments**.
---