# Settlements - Settlement groups
[](https://help.cairo.pl/uploads/images/gallery/2026-04/5cziyYxEWUYRi5yd-image.png)
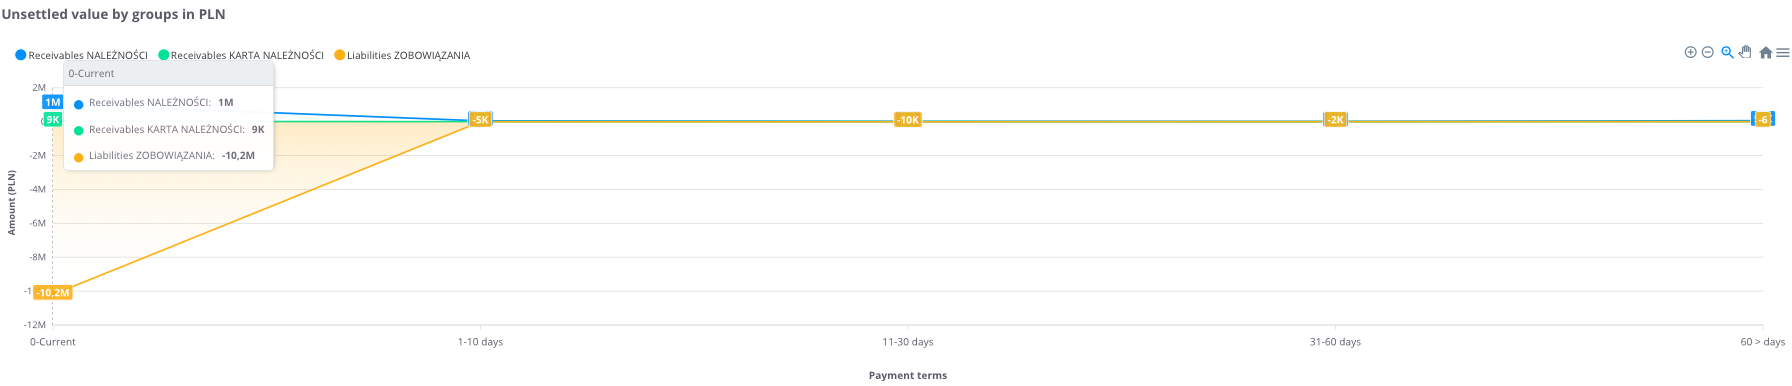
**“Unsettled value by groups in PLN”** – the chart presents **receivables and liabilities broken down by settlement groups and overdue periods**. This makes it possible to see how values are distributed across different categories and in which time ranges the largest delays occur.
The chart displays:
- **Liabilities** – amounts the company should settle,
- **Receivables** – amounts expected from contractors.
The data is divided into the following time intervals:
- **0 – current** – settlements for which the payment due date has not yet passed,
- **1–10 days** – settlements overdue by up to 10 days,
- **11–30 days** – settlements overdue between 11 and 30 days,
- **31–60 days** – settlements overdue between 31 and 60 days,
- **60> days** – settlements overdue by more than 60 days.
Thanks to this chart, the user can easily assess **which settlement groups generate the largest receivables and liabilities**, as well as **how their structure is distributed by overdue period**.
---
### **Unsettled value by groups in PLN - table**
[](https://help.cairo.pl/uploads/images/gallery/2026-03/pJEiK0YfOEl56XJb-image.png)
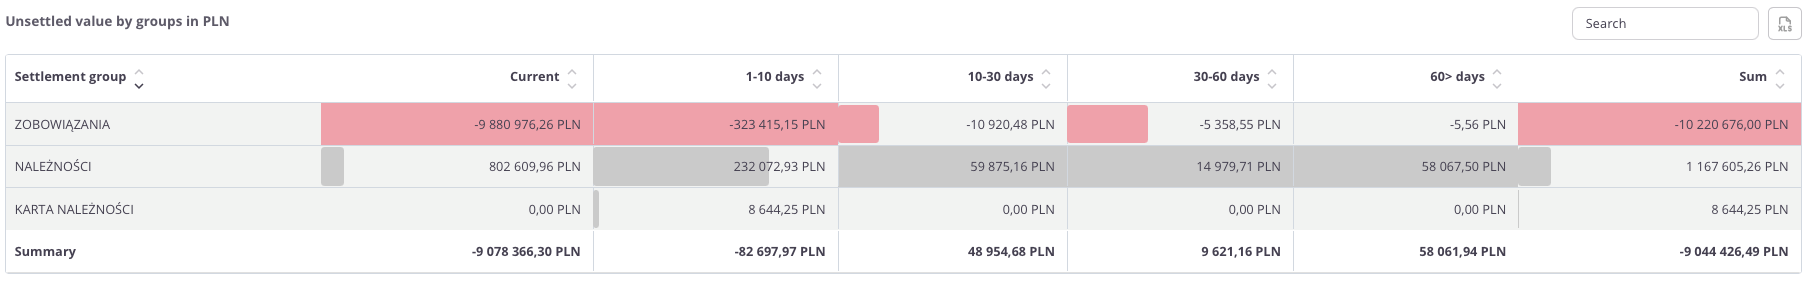
**“Unsettled value by groups in PLN – table”** – this summary presents **receivables and liabilities broken down by settlement groups**. This allows users to analyze which groups generate the largest burdens and how delays are distributed over time.
The table includes the following fields:
- **Settlement group** – the category to which the settlements are assigned,
- **Current** – settlements for which the payment due date has not yet passed,
- **1–10 days** – settlements overdue by up to 10 days,
- **10–30 days** – settlements overdue between 11 and 30 days,
- **30–60 days** – settlements overdue between 31 and 60 days,
- **60> days** – settlements overdue by more than 60 days,
- **Sum** – the total value of settlements in the given group.
The table uses **color highlighting**:
- **Red bar** – its length reflects the volume of liabilities; the longer the bar, the higher the total amount payable.
- **Grey bar** – its length corresponds to the volume of receivables; the longer the bar, the higher the total amount due.
-
Thanks to this, the user can quickly **identify settlement groups with the largest overdue amounts** and assess the **balance between receivables and liabilities over time**.
The table includes a **search field** that allows narrowing the data to selected groups. In such cases, **summaries automatically adjust** to the filtered results.
---