# Settlements - Warehouses

### Unsettled value by warehouse in PLN – table

[![image.png](https://help.cairo.pl/uploads/images/gallery/2026-03/scaled-1680-/QnRYsuVieNby8yDC-image.png)](https://help.cairo.pl/uploads/images/gallery/2026-03/QnRYsuVieNby8yDC-image.png)

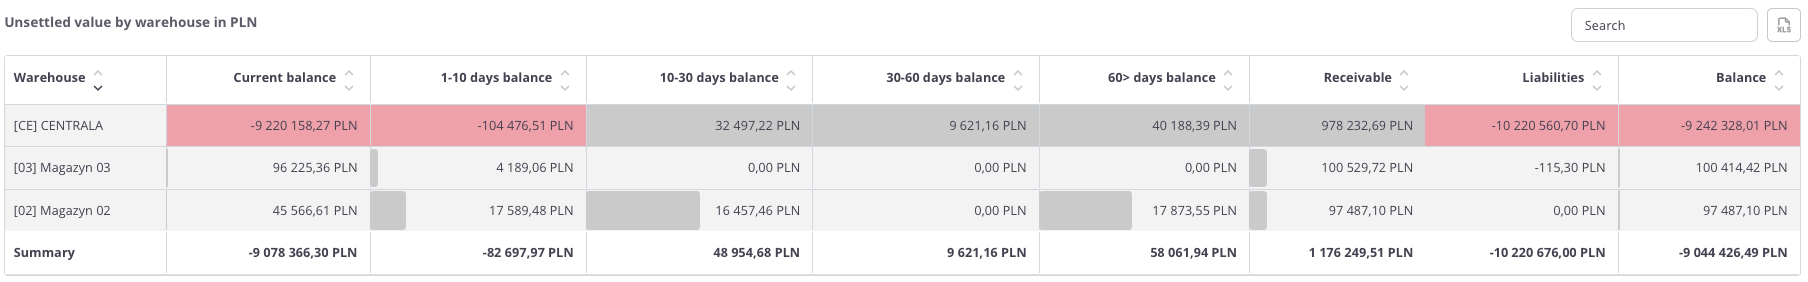
**“Unsettled value by warehouse in PLN – table”** – this summary presents **receivables and liabilities broken down by individual warehouses**. For each warehouse, the following data is displayed:

- **Current balance** – settlements for which the payment due date has not yet passed,
- **1–10 days balance** – settlements overdue by up to 10 days,
- **10–30 days balance** – settlements overdue between 10 and 30 days,
- **30–60 days balance** – settlements overdue between 30 and 60 days,
- **60&gt; days balance** – settlements overdue by more than 60 days,
- **Receivables** – the total value of receivables assigned to the warehouse,
- **Liabilities** – the total value of liabilities assigned to the warehouse,
- **Balance** – the difference between receivables and liabilities.

The table uses **color highlighting**:

- **<span style="color: rgb(224, 62, 45);">Red</span> bar** – its length reflects the volume of liabilities; the longer the bar, the higher the total amount payable.
- **<span style="color: rgb(126, 140, 141);">Grey</span> bar** – its length corresponds to the volume of receivables; the longer the bar, the higher the total amount due.

Thanks to this, the user can quickly identify **warehouses with the largest overdue liabilities (values below zero)** and see **positive balance values (above zero)**.

The table includes a **search field** that allows narrowing the data to selected warehouses. In such cases, **summaries automatically adjust** to the **filtered results**.

Additionally, data can be **sorted by clicking the column headers** – for example, to arrange warehouses by balance value or by the amount of liabilities.

---

<article class="text-token-text-primary w-full focus:outline-none scroll-mt-[calc(var(--header-height)+min(200px,max(70px,20svh)))]" data-scroll-anchor="true" data-testid="conversation-turn-351" data-turn="assistant" data-turn-id="request-68d24bac-c560-832f-9269-08a13185b5ab-18" dir="auto" id="bkmrk-receivables-in-pln" tabindex="-1">### **Receivables in PLN**

</article>[![image.png](https://help.cairo.pl/uploads/images/gallery/2026-04/scaled-1680-/UAVH0NUuM5MKGyFX-image.png)](https://help.cairo.pl/uploads/images/gallery/2026-04/UAVH0NUuM5MKGyFX-image.png)

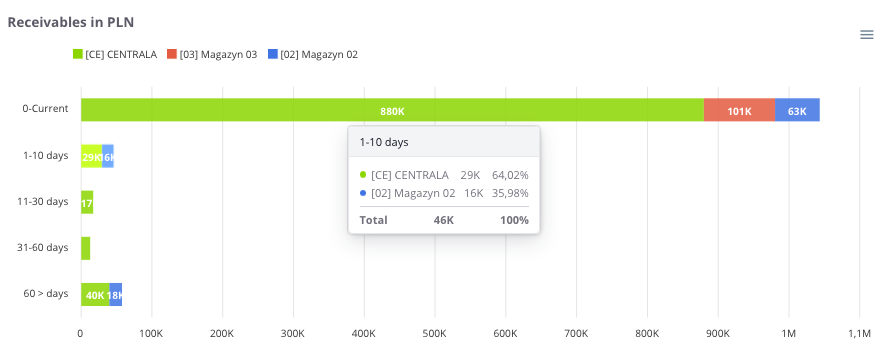
**“Receivables in PLN”** – the chart presents the **value of receivables broken down by warehouses**. Each warehouse is marked with a different color, allowing for a quick assessment of its share in the total amount of receivables.

The chart also includes **time intervals for overdue receivables**:

- **0 – current** – receivables for which the payment due date has not yet passed,
- **1–10 days** – receivables overdue by up to 10 days,
- **10–30 days** – receivables overdue between 10 and 30 days,
- **30–60 days** – receivables overdue between 30 and 60 days,
- **60&gt; days** – receivables overdue by more than 60 days (the most risky portion of the receivables portfolio).

Thanks to this, the chart allows users not only to **compare receivable loads between warehouses** but also to **analyze the structure of overdue amounts**.

---

<article class="text-token-text-primary w-full focus:outline-none scroll-mt-[calc(var(--header-height)+min(200px,max(70px,20svh)))]" data-scroll-anchor="true" data-testid="conversation-turn-355" data-turn="assistant" data-turn-id="request-68d24bac-c560-832f-9269-08a13185b5ab-20" dir="auto" id="bkmrk-liabilities-in-pln" tabindex="-1">### **Liabilities in PLN**

</article>[![image.png](https://help.cairo.pl/uploads/images/gallery/2026-04/scaled-1680-/Wo3VCVZOZzIl5kpR-image.png)](https://help.cairo.pl/uploads/images/gallery/2026-04/Wo3VCVZOZzIl5kpR-image.png)

<article class="text-token-text-primary w-full focus:outline-none scroll-mt-[calc(var(--header-height)+min(200px,max(70px,20svh)))]" data-scroll-anchor="true" data-testid="conversation-turn-357" data-turn="assistant" data-turn-id="request-68d24bac-c560-832f-9269-08a13185b5ab-21" dir="auto" id="bkmrk-%E2%80%9Cliabilities-in-pln%E2%80%9D" tabindex="-1">**“Liabilities in PLN”** – the chart presents the **value of liabilities broken down by warehouses**. Each warehouse is marked with a **different color**, allowing comparison of their share in the total amount of liabilities.

The chart also includes **time intervals for overdue liabilities**:

<div class="text-base my-auto mx-auto pb-10 [--thread-content-margin:--spacing(4)] thread-sm:[--thread-content-margin:--spacing(6)] thread-lg:[--thread-content-margin:--spacing(16)] px-(--thread-content-margin)"><div class="[--thread-content-max-width:40rem] thread-lg:[--thread-content-max-width:48rem] mx-auto max-w-(--thread-content-max-width) flex-1 group/turn-messages focus-visible:outline-hidden relative flex w-full min-w-0 flex-col agent-turn" tabindex="-1"><div class="flex max-w-full flex-col grow"><div class="min-h-8 text-message relative flex w-full flex-col items-end gap-2 text-start break-words whitespace-normal [.text-message+&]:mt-5" data-message-author-role="assistant" data-message-id="fe0ac746-94d2-48f1-85ed-948611f4a305" data-message-model-slug="gpt-5" dir="auto"><div class="flex w-full flex-col gap-1 empty:hidden first:pt-[1px]"><div class="markdown prose dark:prose-invert w-full break-words dark markdown-new-styling">- **0 – current** – liabilities for which the payment due date has not yet passed,
- **1–10 days** – liabilities overdue by up to 10 days,
- **10–30 days** – liabilities overdue between 10 and 30 days,
- **30–60 days** – liabilities overdue between 30 and 60 days,
- **60&gt; days** – liabilities overdue by more than 60 days (the most risky portion of the liabilities portfolio).

</div></div></div></div></div></div>Thanks to this, the chart allows users to **assess which warehouses account for the highest liability values** and how their **structure changes over time**.

---

</article>