# Warehouse - Warehouse values by producers
### Value by producers – Top 100
[](https://help.cairo.pl/uploads/images/gallery/2026-04/iJ6h3lT95LIOcWts-image.png)
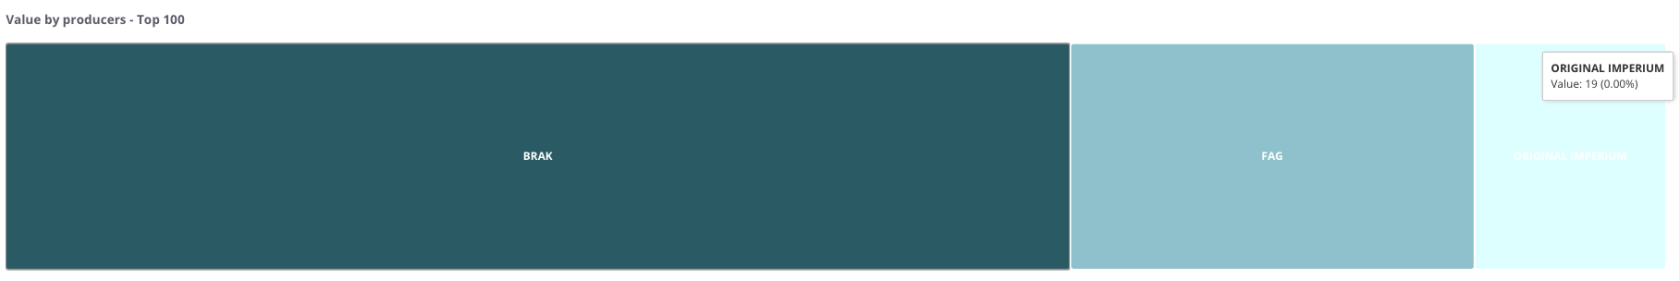
**“Value by producers – Top 100”** – the chart presents the **100 producers with the highest warehouse stock value.**
Each rectangle represents one manufacturer:
- **the size of the field** reflects the stock value assigned to that manufacturer,
- **the color** distinguishes individual manufacturers from one another.
Thanks to this visualization, it is easy to identify **which manufacturers account for the largest share of total warehouse value** and to compare their **percentage contribution** within the overall stock structure.
---
### Value by producers – table
[](https://help.cairo.pl/uploads/images/gallery/2026-04/4B4BhUvCVAH7TuSJ-image.png)
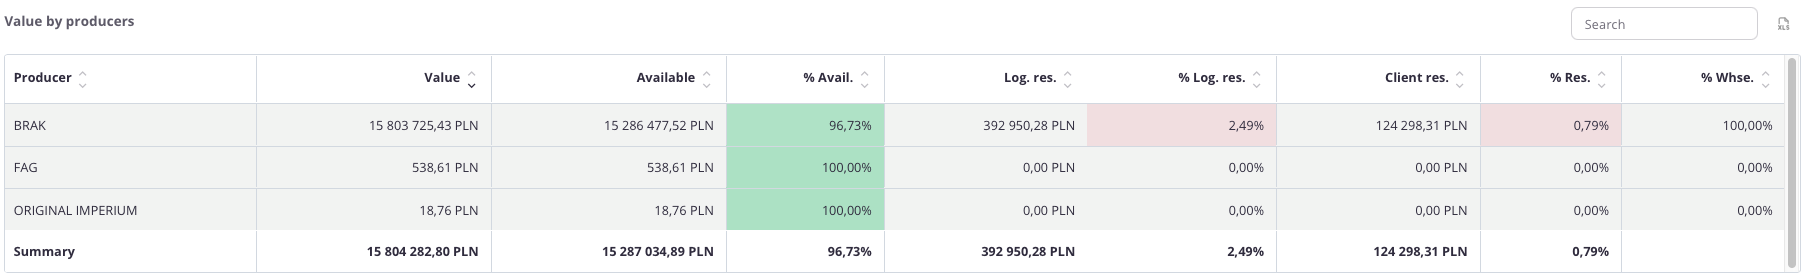
**“Value by producers – table”** – this summary presents **stock values broken down by individual producers**. For each manufacturer, the following data is displayed:
- **Value**,
- **Available value** and its percentage share (**% Avail.**),
- **Logistics reservations value** with its percentage share (**% Log.res.**),
- **Client reservations value** with its percentage share (**% Res.**),
- **Producer’s percentage share** in total warehouse stock (**% Whse.**).
The table uses **color highlighting** for easier interpretation:
- **Green** – the more intense the color, the higher the share of goods available for sale,
- **Red** – the more intense the color, the greater the share of goods blocked in logistics or customer reservations.
This allows the user to quickly assess not only numerical values but also **the proportions between available and reserved stock** for each manufacturer.
The table includes a **search field** that allows narrowing the data to selected manufacturers. In such cases, **summaries automatically adjust** **to the filtered results**.
Additionally, data can be **sorted by clicking column headers** – for example, to arrange manufacturers by total value or by the percentage share of reservations.