# Warehouse - Warehouse values by product groups
### Product group value – Top 25
[](https://help.cairo.pl/uploads/images/gallery/2026-04/YV4HJSFlUpMyJSnE-image.png)
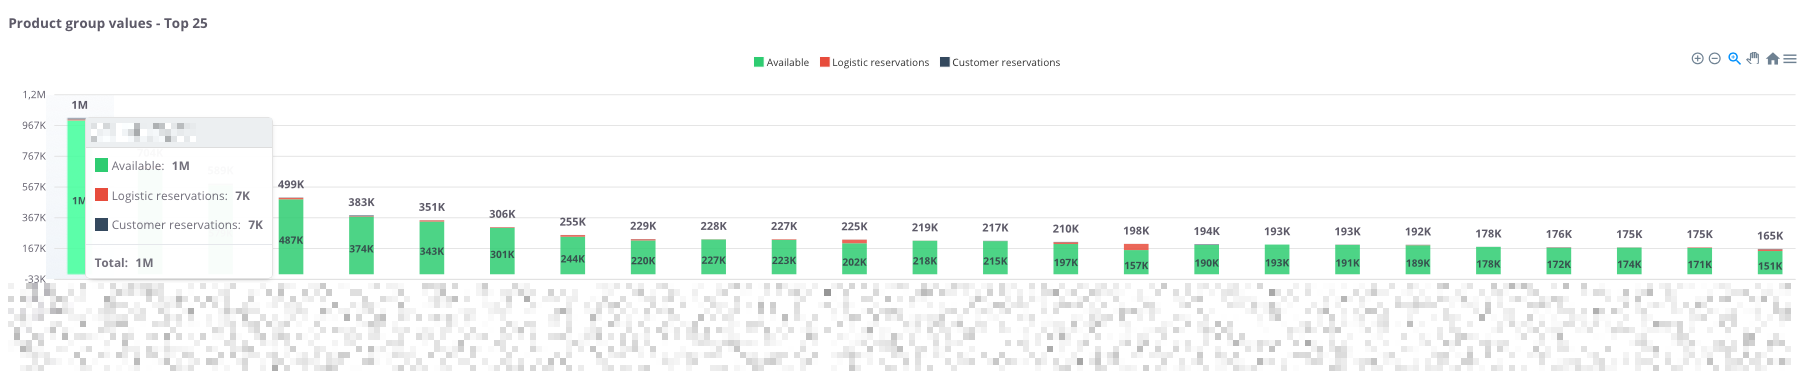
**“Product group values – Top 25”** – the chart presents the **25 product groups with the highest stock value**. For each group, the following components are shown:
- **Available (green)** – goods ready for sale,
- **Logistics reservations (red)** – stock blocked for logistics processes,
- **Customer reservations (black)** – goods reserved for specific orders.
Thanks to this, the chart allows users to **quickly assess which product groups generate the highest warehouse value**, as well as determine **what portion of the stock is available versus reserved.**
---
### **Product group values – table**
[](https://help.cairo.pl/uploads/images/gallery/2026-04/eQqZGfqJfuQBv6yA-image.png)
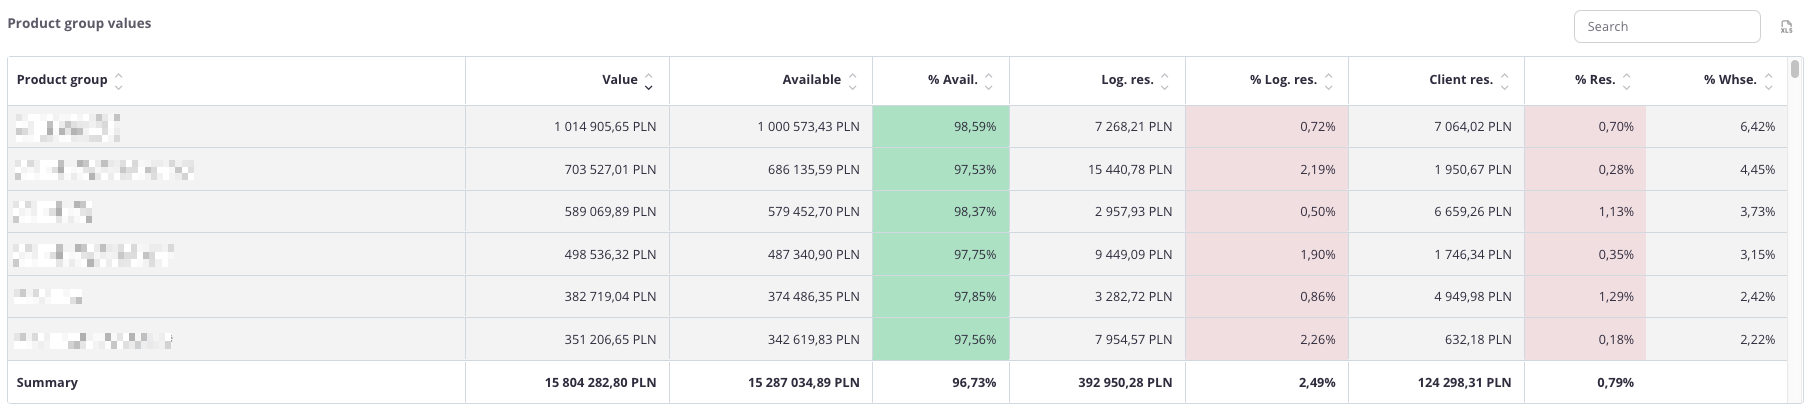
**“Product group values – table”** – the table presents the **value of inventory across individual product groups**. For each group, the following data is displayed:
- **Value**,
- **Available value** and its percentage share (**% Avail.**),
- **Logistics reservations value** and its percentage share (**% Log.res.**),
- **Client reservations value** and its percentage share (**% Res.**),
- **Group’s percentage share** in total warehouse inventory (**% Whse.**).
The table uses **color highlighting**:
- **Green** – the more intense the color, the higher the share of goods available for sale,
- **Red** – the more intense the color, the higher the share of goods blocked in logistics or customer reservations.
Thanks to this, users can quickly assess **not only numerical values but also the proportions between availability and reservations** within each product group.
The table includes a **search field**, allowing users to narrow the data to selected groups. In such cases, **summaries automatically adjust** to the filtered results.
Additionally, data can be **sorted by clicking column headers** – for example, to arrange groups by **total value** or **percentage share of reservations**.