
Home tab
The Home tab in the cairo.BI system provides a summary of key financial and operational information, enabling a quick overview of the company’s situation. It is a kind of start dashboard that combines the most important indicators from sales, settlements, and warehouse management.
The screen includes the following elements:
-
Net sales in the month – presents the current sales result along with the change compared to the previous month.
-
Sales profit in the month – shows how much the company actually earned in the given month.
-
Profit percentage in the month – a profitability indicator calculated as a percentage, making it easier to assess sales margins.
-
Net sales in the year – the value of sales in annual terms.
-
Sales profit in the year – the cumulative financial result.
-
Profit percentage in the year – profitability on an annual scale.
Additionally, the user has access to detailed charts:
-
Unsettled value in PLN – a pie chart showing the proportions between receivables and liabilities, along with their aging (e.g., current, 1–10 days, 11–30 days, 31–60 days, 60> days).
-
Sales by months – a column-line chart comparing sales and profit broken down by months, set against the previous year.
-
Warehouse value – a visualization showing the share of individual warehouses in the total stock value.
The Home tab is the center of quick insights, allowing for instant analysis of sales results, profits, liabilities, and inventory status. Thanks to this, managers can react quickly to changes and make accurate business decisions.
All values are calculated based on sales documents (WZ, PG, GP, ZW).
All values are converted to PLN according to the exchange rate of the previous day, which ensures consistent presentation regardless of the document currency.
Net sales in the month
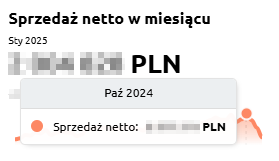
The Net sales in the month indicator presents the value of sales achieved in a given month, including a comparison to the result from the previous period. This makes it easy to quickly assess whether the sales dynamics are increasing or decreasing.
The chart displays:
-
net sales value in the selected month,
-
monthly trend – a line showing changes in sales over time,
-
reference to the previous month – percentage information about increase or decrease.
Thanks to this indicator, the user can easily monitor the current condition of sales and track short-term changes in the company’s performance.
Sales profit in the month
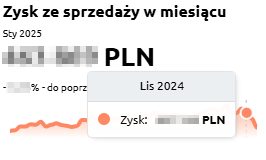
The Sales profit in the month indicator presents the monthly financial result, meaning the difference between sales revenues and the costs of generating them. This makes it possible to continuously monitor how the company generates margin in the short term.
The chart displays:
-
profit achieved in the given month,
-
monthly trend – a line illustrating changes over time,
-
reference to the previous month – percentage information about increase or decrease of the result.
Thanks to this indicator, the user can quickly verify whether sales are profitable in the short term, and detect possible declines or increases in profitability in individual months.
Profit percentage in the month
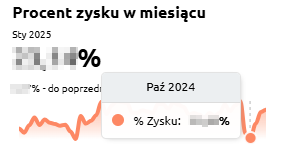
The Profit percentage in the month indicator shows what portion of the revenues achieved in a given month represents profit after deducting costs. It is a key measure of profitability that makes it possible to assess whether the company maintains an appropriate level of operating margin.
The chart presents:
Thanks to this indicator, the user can quickly verify whether the margin remains at a safe level, as well as identify moments when the company operated with higher or lower financial efficiency.
Net sales in the year
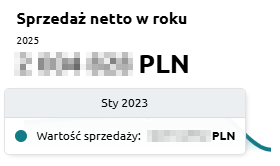
The Net sales in the year indicator presents the total value of sales achieved in a given calendar year. It makes it possible to analyze how the company develops on an annual basis and to compare results between individual years.
The chart presents:
-
net sales value in the given year,
-
time axis – enabling observation of year-to-year changes,
-
sales trend – allowing quick assessment of whether the company is increasing its scale of operations or experiencing sales declines.
Thanks to this indicator, the user gains a complete picture of how the company has been performing over the years, which forms the basis for assessing long-term stability and business growth.