
Payment deadlines
All values are converted to PLN according to the exchange rate of the previous day, ensuring consistent presentation regardless of the document currency.
Unsettled value in PLN
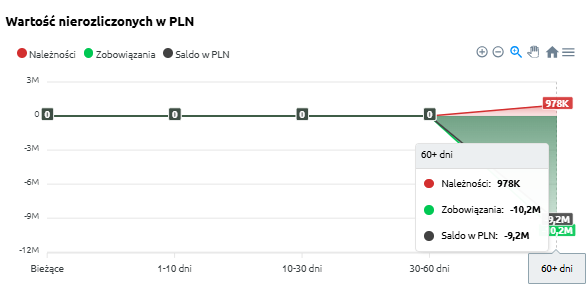
“Unsettled value in PLN” – the chart presents outstanding settlements over time, broken down by overdue periods. This makes it possible to see how the structure of receivables and liabilities changes across different time intervals.
The chart displays:
-
Receivables (red) – amounts expected from contractors that have not yet been settled,
-
Liabilities (green) – amounts the company should pay to suppliers,
-
Balance in PLN (black) – the difference between receivables and liabilities within a given overdue period.
Thanks to this chart, the user can quickly identify whether the company faces a greater issue with delayed payments from customers (receivables) or with its own overdue liabilities.
Unsettled value in PLN – table
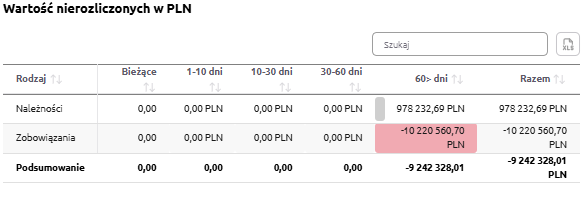
“Unsettled value in PLN – table” – this summary presents outstanding receivables and liabilities broken down by overdue periods. For each category, the following values are displayed:
-
Current – settlements for which the payment term has not yet expired,
-
1–10 days – settlements overdue by up to 10 days,
-
10–30 days – settlements overdue between 10 and 30 days,
-
30–60 days – settlements overdue between 30 and 60 days,
-
60> days – settlements overdue by more than 60 days,
-
Total – the overall value of receivables and liabilities.
The table uses color highlighting:
-
Red – the more intense the shade, the higher the value of liabilities in a given overdue period.
Thanks to this, the user can easily identify which time ranges show the largest payment delays and understand the proportions between receivables and liabilities.
The table includes a search field that allows narrowing the data to selected records. In such cases, summaries automatically adjust to the filtered results.
Additionally, data can be sorted by clicking column headers – for example, to arrange settlements according to values within a selected time range.
Value of liabilities in PLN
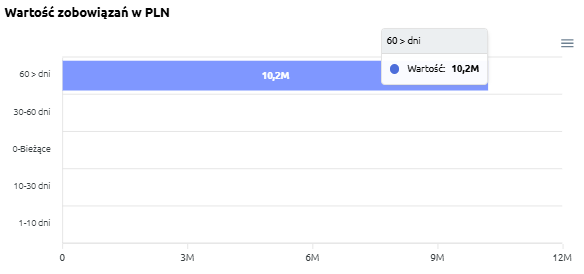
“Value of liabilities in PLN” – the chart presents the company’s liabilities broken down by overdue periods. It allows users to check which portion of liabilities is current and which requires immediate attention.
The chart displays:
-
Current – liabilities for which the payment due date has not yet passed,
-
1–10 days – liabilities overdue by up to 10 days,
-
10–30 days – liabilities overdue between 10 and 30 days,
-
30–60 days – liabilities overdue between 30 and 60 days,
-
60> days – liabilities overdue by more than 60 days (the most risky portion of the liabilities portfolio).
Thanks to this, the user can quickly assess where the company’s largest financial burden is concentrated and take appropriate actions to improve liquidity.
Value of receivables in PLN
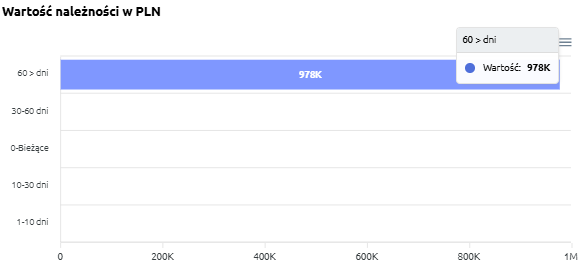
“Value of receivables in PLN” – the chart presents the company’s receivables broken down by overdue periods. It allows users to check which portion of receivables is current and which is already past due.
The chart displays:
-
Current – receivables for which the payment due date has not yet passed,
-
1–10 days – receivables overdue by up to 10 days,
-
10–30 days – receivables overdue between 10 and 30 days,
-
30–60 days – receivables overdue between 30 and 60 days,
-
60> days – receivables overdue by more than 60 days (the most risky portion of the receivables portfolio).
Thanks to this, the user can easily assess which receivables require urgent collection actions and what is the risk of delays in incoming payments.