
Purchases by countries
All values are calculated based on purchase documents (PZ, P-).
All values are converted to PLN according to the exchange rate of the previous day, ensuring a consistent presentation regardless of the document currency.
Purchases by country
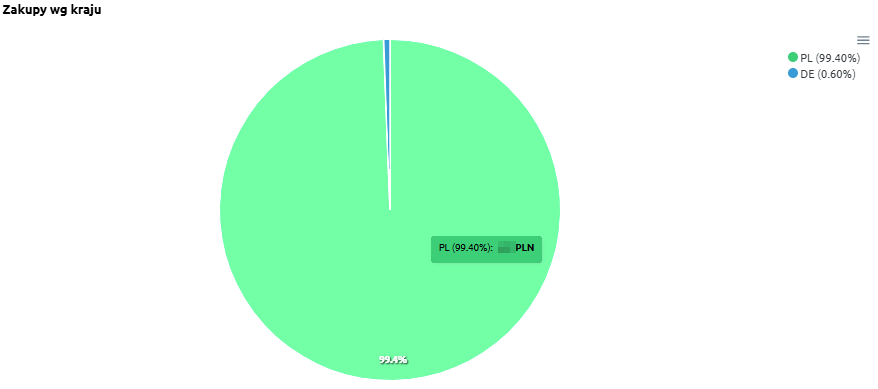
“Purchases by country” – the chart presents the share of purchases broken down by countries from which goods and services originate. It allows users to see in which markets the company incurs the highest purchasing costs.
The chart displays:
-
countries of purchase – each country is marked with a different color,
-
percentage share – showing what portion of total purchase value each country represents.
Thanks to this chart, users can easily identify which country dominates the purchase structure and which markets play a smaller role.
Purchases by country – table
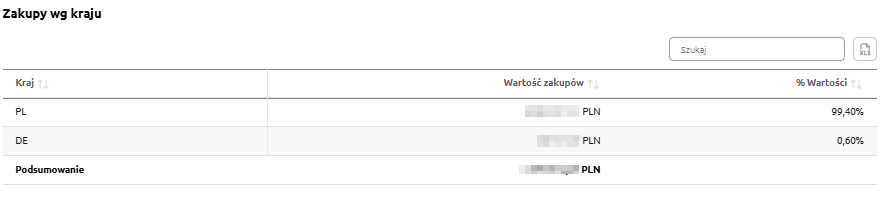
“Purchases by country – table” – the table presents the value of purchases broken down by countries. It allows users to determine which markets have the largest share in the company’s purchasing structure.
The table includes the following fields:
-
Country – name of the country,
-
Purchase value – total expenditure on purchases made in that country,
-
% Value – percentage share of the country in total company purchases.
The table includes a search field, allowing users to narrow the data to selected countries. In such cases, summaries automatically adjust to the filtered results.
Additionally, data can be sorted by clicking column headers – for example, to arrange countries by purchase value or percentage share.
Thanks to this table, users can easily assess which markets dominate the purchase structure and which ones have marginal significance.