
Sales by countries
All values are calculated based on sales documents (WZ, PG, GP, ZW).
All values are converted to PLN according to the exchange rate of the previous day, ensuring consistent presentation regardless of the document currency.
Sales by countries
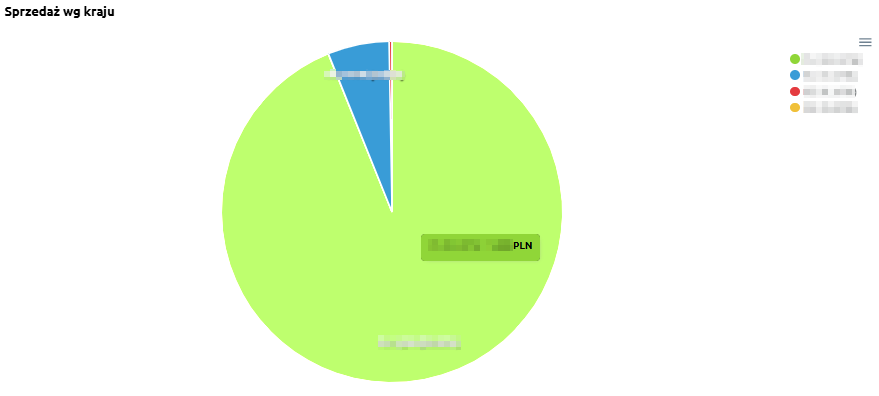
“Sales by country” – the chart presents the share of sales broken down by countries where the company operates. It allows users to see which markets generate the highest revenue.
The chart displays:
Thanks to this, users can easily identify which market is dominant and which countries play a smaller role in the overall sales structure.
Sales by country - table
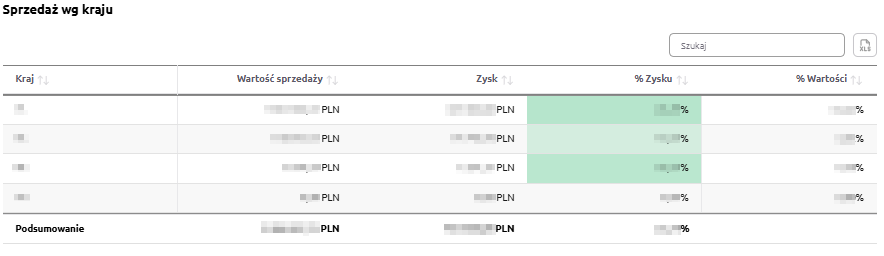
“Sales by country – table” – this summary presents sales data broken down by countries. It allows users to identify which markets generate the highest sales and profit values, and which have less significance in the overall structure.
The table includes the following fields:
-
Country – name of the country,
-
Sales value – total sales made in the given market,
-
Profit – financial result generated by sales in that country,
-
% Profit – percentage share of profit in total sales value,
-
% Value – percentage share of the country in total company sales.
The table uses color highlighting:
-
Green – the more intense the color, the higher the profit percentage,
-
Red – indicates negative values, representing a loss.
The table includes a search field, allowing users to narrow the data to selected countries. In such cases, summaries automatically adjust to the filtered results.
Additionally, data can be sorted by clicking column headers – for example, to arrange countries by sales value, profit, or profitability.