
Sales by routes
All values are calculated based on sales documents (WZ, PG, GP, ZW).
All values are converted to PLN according to the exchange rate of the previous day, ensuring consistent presentation regardless of the document currency.
Sales by routes
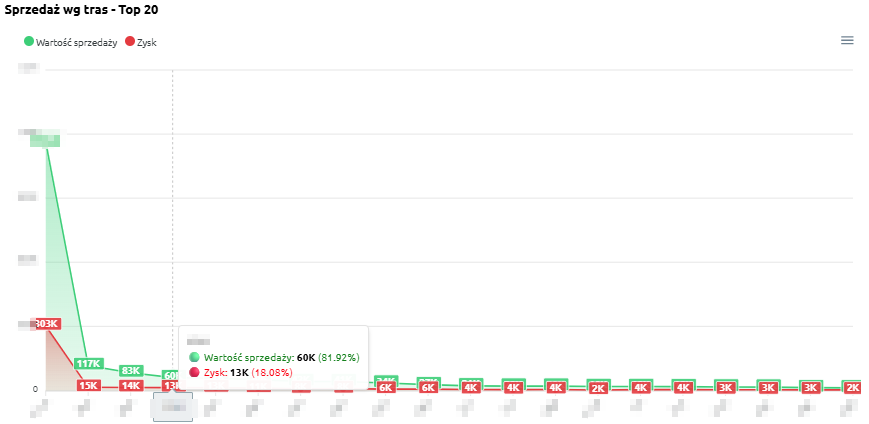
“Sales by routes – Top 20” – the chart presents the 20 routes with the highest sales value, along with the corresponding profit. This makes it possible to identify which routes are the most profitable and how their profitability levels compare.
The chart displays:
Thanks to this chart, users can easily compare which routes generate the highest revenue, as well as assess whether the profit share is proportional to the sales value.
Sales by routes - table
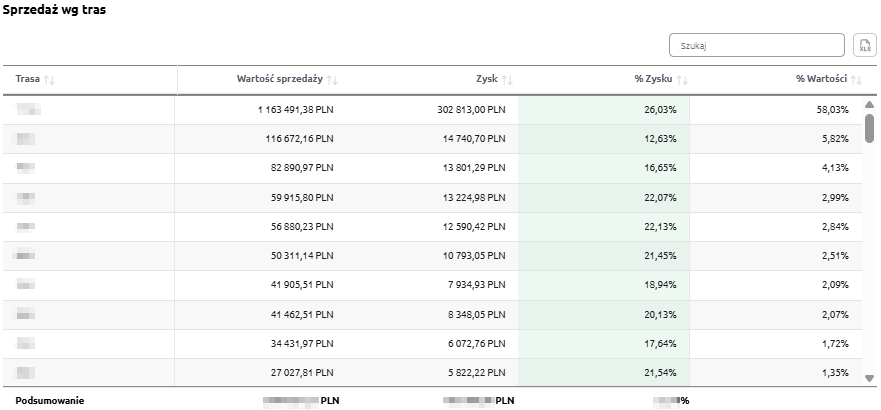
“Sales by routes – table” – this summary presents sales data broken down by individual routes. It allows users to identify which routes generate the highest revenue and profit, as well as assess their share in total company sales.
The table includes the following fields:
The table uses color highlighting:
The table includes a search field, allowing users to narrow the data to selected routes. In such cases, summaries automatically adjust to the filtered results.
Additionally, data can be sorted by clicking column headers – for example, to arrange routes by sales value, profit, or profitability.
Thanks to this, users can easily identify the most profitable routes and understand their importance within the company’s overall sales structure.