
Settlement groups
Unsettled value by groups in PLN
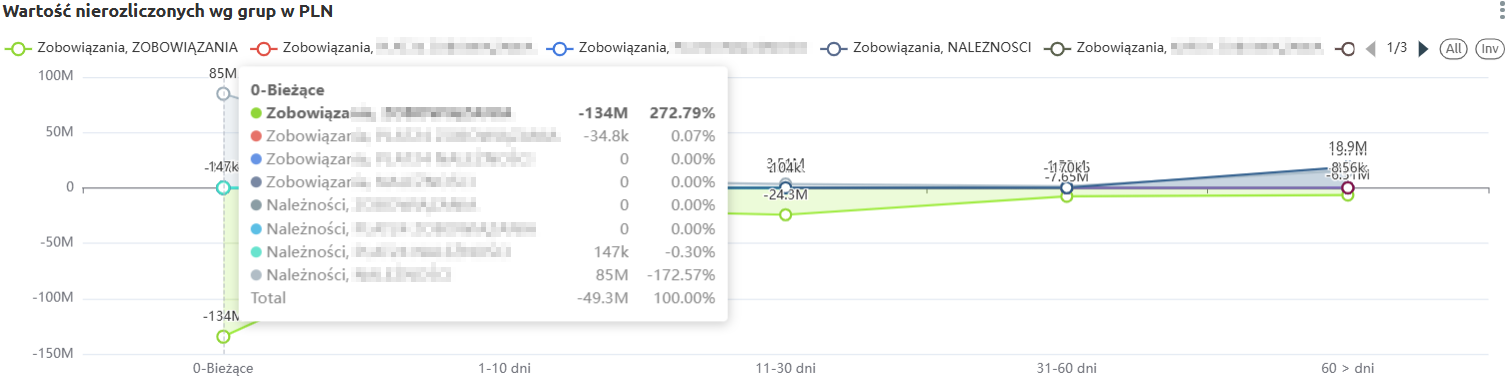
“Unsettled value by groups in PLN” – the chart presents receivables and liabilities broken down by settlement groups and overdue periods. This makes it possible to see how values are distributed across different categories and in which time ranges the largest delays occur.
The chart displays:
-
Liabilities – amounts the company should settle,
-
Receivables – amounts expected from contractors.
The data is divided into the following time intervals:
-
0 – current – settlements for which the payment due date has not yet passed,
-
1–10 days – settlements overdue by up to 10 days,
-
11–30 days – settlements overdue between 11 and 30 days,
-
31–60 days – settlements overdue between 31 and 60 days,
-
60> days – settlements overdue by more than 60 days.
Thanks to this chart, the user can easily assess which settlement groups generate the largest receivables and liabilities, as well as how their structure is distributed by overdue period.
Unsettled value by groups in PLN - table
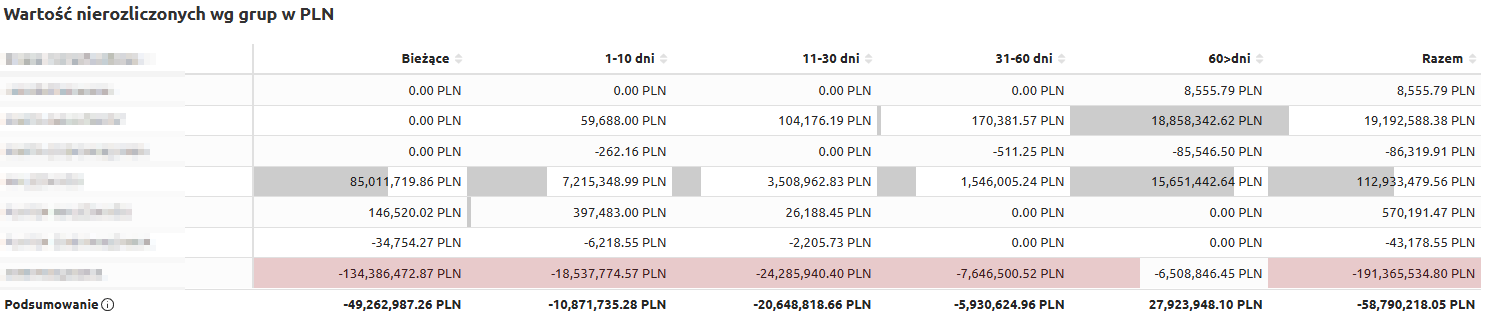
“Unsettled value by groups in PLN – table” – this summary presents receivables and liabilities broken down by settlement groups. This allows users to analyze which groups generate the largest burdens and how delays are distributed over time.
The table includes the following fields:
-
Settlement group – the category to which the settlements are assigned,
-
Current – settlements for which the payment due date has not yet passed,
-
1–10 days – settlements overdue by up to 10 days,
-
11–30 days – settlements overdue between 11 and 30 days,
-
31–60 days – settlements overdue between 31 and 60 days,
-
60> days – settlements overdue by more than 60 days,
-
Total – the total value of settlements in the given group.
The table uses color highlighting:
-
Red – the more intense the color, the lower the value (below 0),
-
Gray – the more intense the color, the higher the value (above 0).
Thanks to this, the user can quickly identify settlement groups with the largest overdue amounts and assess the balance between receivables and liabilities over time.
The table includes a search field that allows narrowing the data to selected groups. In such cases, summaries automatically adjust to the filtered results.