
Warehouse - Warehouse values by producers
Value by manufacturersproducers – Top 100
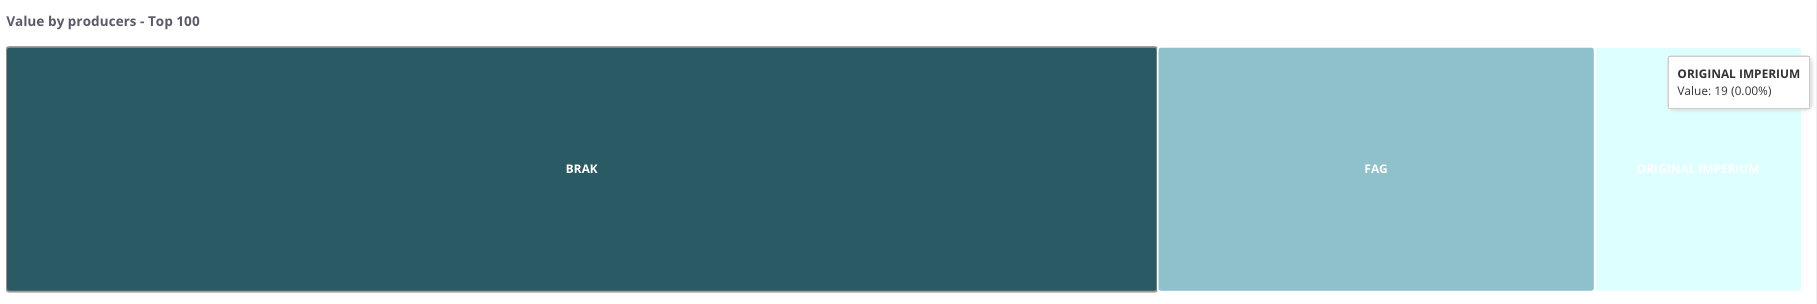
“Value by manufacturersproducers – Top 100” – the chart presents the 100 manufacturersproducers with the highest warehouse stock value.
Each rectangle represents one manufacturer:
-
the size of the field reflects the stock value assigned to that manufacturer,
-
the color distinguishes individual manufacturers from one another.
Thanks to this visualization, it is easy to identify which manufacturers account for the largest share of total warehouse value and to compare their percentage contribution within the overall stock structure.
Value by manufacturersproducers – table
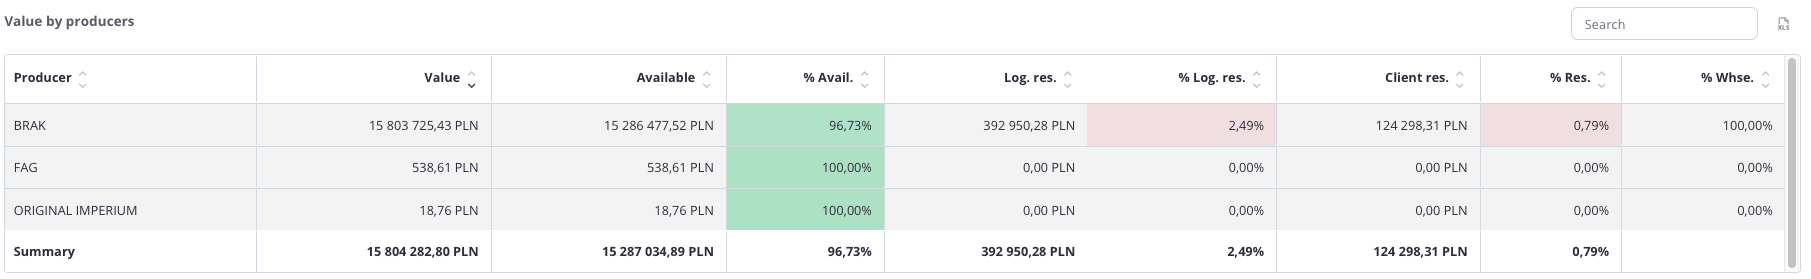
“Value by manufacturersproducers – table” – this summary presents stock values broken down by individual manufacturersproducers. For each manufacturer, the following data is displayed:
-
Total valueValue, -
Available value and its percentage share (% Avail.),
-
Logistics reservations value with its percentage share (% Log.res.),
-
CustomerClient reservations value with its percentage share (%Cust.Res.), -
Manufacturer’Producer’s percentage share in total warehouse stock (%Wh.Whse.).
The table uses color highlighting for easier interpretation:
-
Green – the more intense the color, the higher the share of goods available for sale,
-
Red – the more intense the color, the greater the share of goods blocked in logistics or customer reservations.
This allows the user to quickly assess not only numerical values but also the proportions between available and reserved stock for each manufacturer.
The table includes a search field that allows narrowing the data to selected manufacturers. In such cases, summaries automatically adjust to the filtered results.
Additionally, data can be sorted by clicking column headers – for example, to arrange manufacturers by total value or by the percentage share of reservations.