
Warehouses
Unsettled value by warehouse in PLN – table
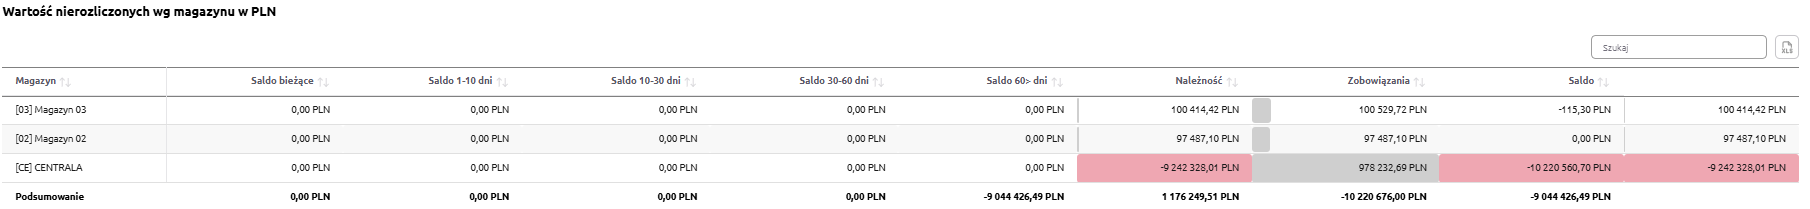
“Unsettled value by warehouse in PLN – table” – this summary presents receivables and liabilities broken down by individual warehouses. For each warehouse, the following data is displayed:
-
Current balance – settlements for which the payment due date has not yet passed,
-
1–10 days balance – settlements overdue by up to 10 days,
-
10–30 days balance – settlements overdue between 10 and 30 days,
-
30–60 days balance – settlements overdue between 30 and 60 days,
-
60> days balance – settlements overdue by more than 60 days,
-
Receivables – the total value of receivables assigned to the warehouse,
-
Liabilities – the total value of liabilities assigned to the warehouse,
-
Balance – the difference between receivables and liabilities.
The table uses color highlighting:
-
Red – the more intense the color, the lower the value (below 0),
-
Gray – the more intense the color, the higher the value (above 0).
Thanks to this, the user can quickly identify warehouses with the largest overdue liabilities (values below zero) and see positive balance values (above zero).
The table includes a search field that allows narrowing the data to selected warehouses. In such cases, summaries automatically adjust to the filtered results.
Additionally, data can be sorted by clicking the column headers – for example, to arrange warehouses by balance value or by the amount of liabilities.
Receivables in PLN
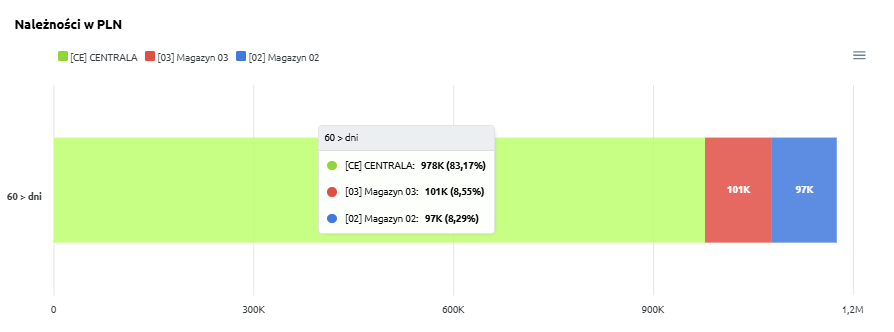
“Receivables in PLN” – the chart presents the value of receivables broken down by warehouses. Each warehouse is marked with a different color, allowing for a quick assessment of its share in the total amount of receivables.
The chart also includes time intervals for overdue receivables:
-
0 – current – receivables for which the payment due date has not yet passed,
-
1–10 days – receivables overdue by up to 10 days,
-
10–30 days – receivables overdue between 10 and 30 days,
-
30–60 days – receivables overdue between 30 and 60 days,
-
60> days – receivables overdue by more than 60 days (the most risky portion of the receivables portfolio).
Thanks to this, the chart allows users not only to compare receivable loads between warehouses but also to analyze the structure of overdue amounts.
Liabilities in PLN
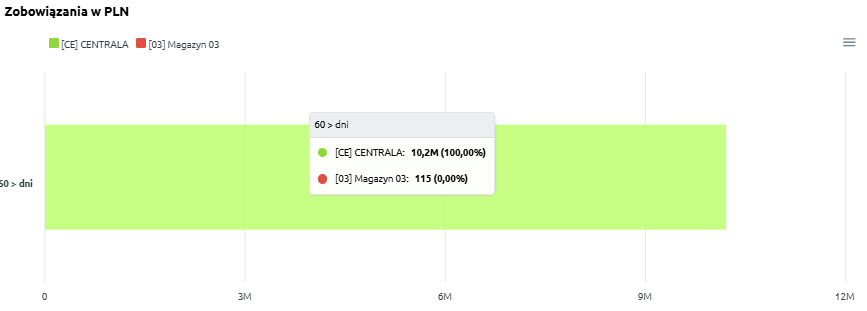
“Liabilities in PLN” – the chart presents the value of liabilities broken down by warehouses. Each warehouse is marked with a different color, allowing comparison of their share in the total amount of liabilities.
The chart also includes time intervals for overdue liabilities:
Thanks to this, the chart allows users to assess which warehouses account for the highest liability values and how their structure changes over time.