
Warehouse - Warehouse values by product groups
Product group value – Top 25
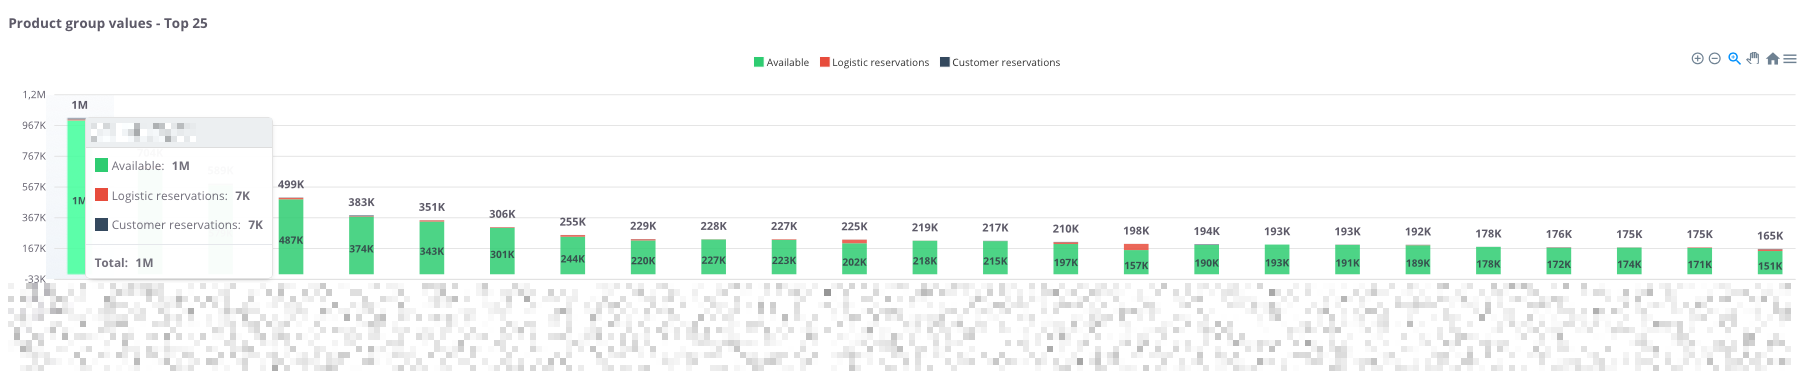
“Product group values – Top 25” – the chart presents the 25 product groups with the highest stock value. For each group, the following components are shown:
-
Available (green) – goods ready for sale,
-
Logistics reservations (red) – stock blocked for logistics processes,
-
Customer reservations (black) – goods reserved for specific orders.
Thanks to this, the chart allows users to quickly assess which product groups generate the highest warehouse value, as well as determine what portion of the stock is available versus reserved.
Product group values – table
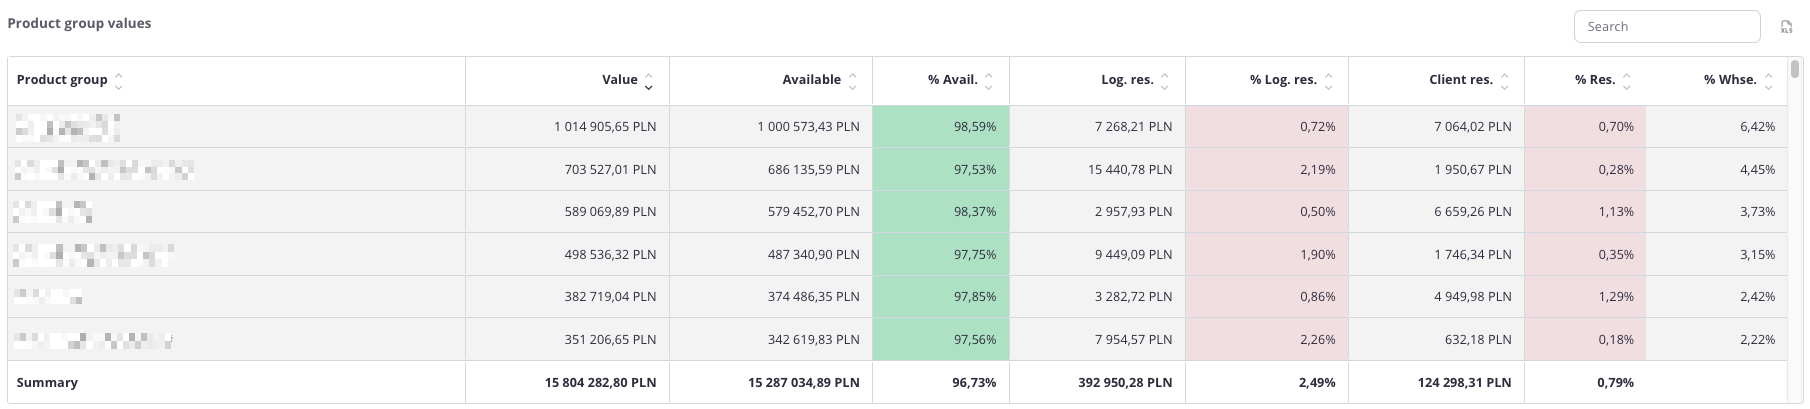
“Product group values – table” – the table presents the value of inventory across individual product groups. For each group, the following data is displayed:
-
Value,
-
Available value and its percentage share (% Avail.),
-
Logistics reservations value and its percentage share (% Log.res.),
-
Client reservations value and its percentage share (% Res.),
-
Group’s percentage share in total warehouse inventory (% Whse.).
The table uses color highlighting:
-
Green – the more intense the color, the higher the share of goods available for sale,
-
Red – the more intense the color, the higher the share of goods blocked in logistics or customer reservations.
Thanks to this, users can quickly assess not only numerical values but also the proportions between availability and reservations within each product group.
The table includes a search field, allowing users to narrow the data to selected groups. In such cases, summaries automatically adjust to the filtered results.
Additionally, data can be sorted by clicking column headers – for example, to arrange groups by total value or percentage share of reservations.