
Annual summary
All values are calculated based on purchase documents (PZ, P-).
All values are converted to PLN according to the exchange rate of the previous day, ensuring a consistent presentation regardless of the document currency.
Purchase value in the year
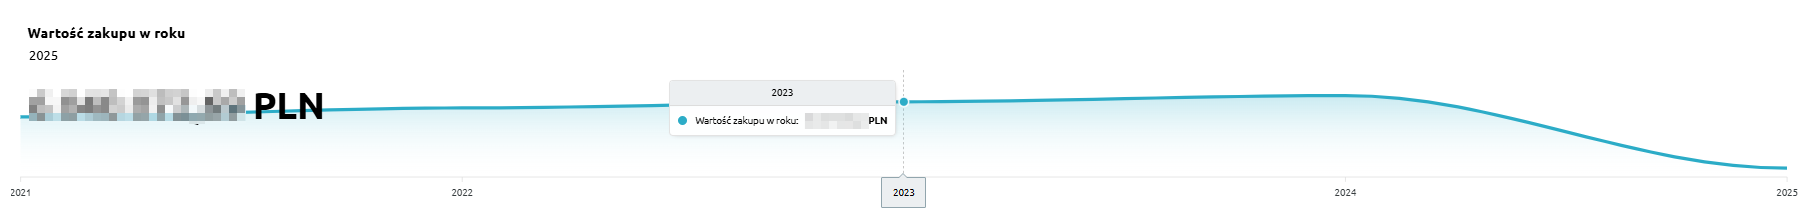
“Purchase value in the year” – the chart presents the annual value of the company’s purchases. It allows users to analyze how purchase costs have evolved over the years and determine whether they show an upward or downward trend.
The chart displays:
-
Purchase value in a given year – total expenditure on purchases during the selected period,
-
Timeline axis – enabling year-to-year comparison of data.
Thanks to this chart, users can easily identify trends in purchasing costs and assess whether expenses remain stable or are subject to greater fluctuations.
Purchases over the years
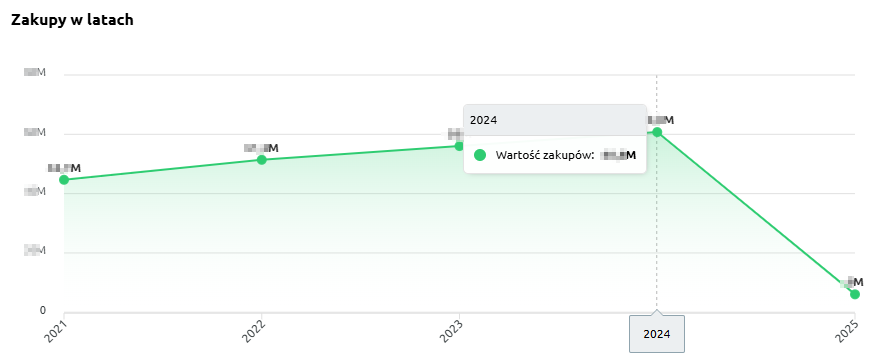
“Purchases over the years” – the chart presents the total value of purchases on an annual basis, allowing the analysis of the company’s spending dynamics over recent years.
The chart shows:
-
purchase values by year – the total amount spent on goods and services,
-
timeline axis – enabling year-to-year comparison of changes,
-
purchase trend line – illustrating increases or decreases in costs over the years.
Thanks to this chart, users can easily assess whether the company’s purchase expenses are rising, declining, or remaining stable, providing a solid foundation for further cost analysis and budget planning.
Purchases over the years – table
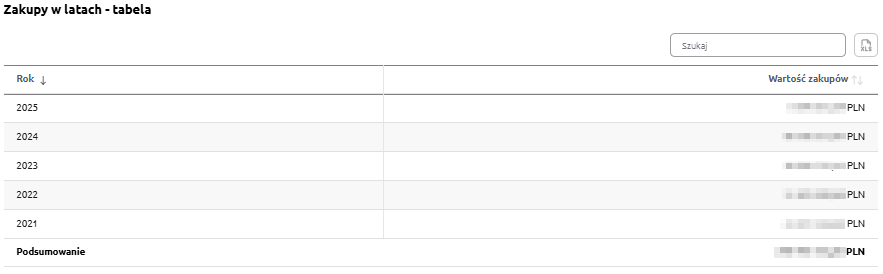
“Purchases over the years – table” – the table presents the value of purchases for each year, allowing users to review how purchasing costs have changed over time and what the total amount was over a longer period.
The table includes the following fields:
-
Year – the period to which the data applies,
-
Purchase value – the total amount of all purchases made in a given year.
The table features a search field that allows users to narrow the data to selected years. In such cases, the summaries automatically adjust to display totals only for the filtered results.
Additionally, data can be sorted by clicking column headers – for example, to arrange years in ascending or descending order based on purchase value.
Thanks to this table, users can quickly analyze changes in purchasing costs over the years and assess whether expenditures show an upward or downward trend.