
Warehouse value summary
Warehouse value
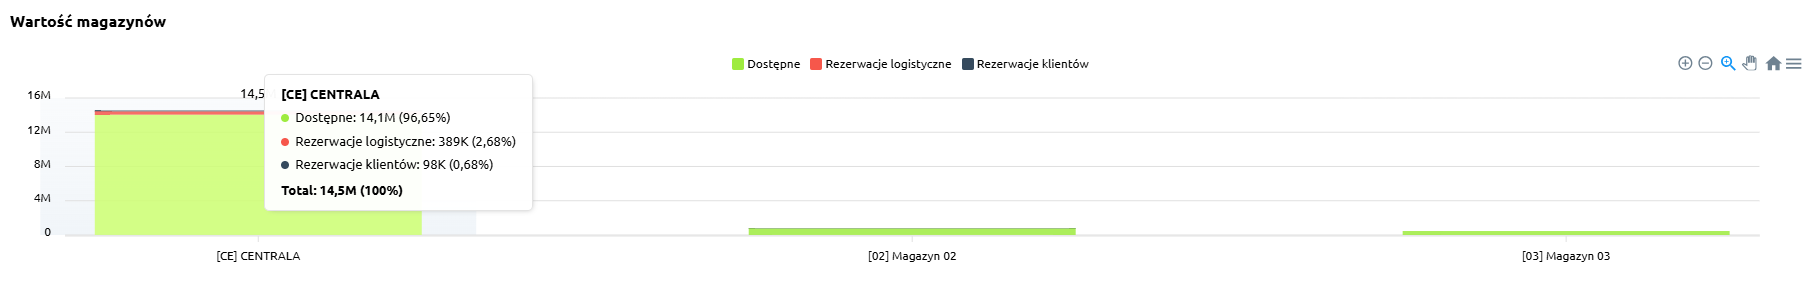
The Warehouse value chart presents the total value of stock across individual warehouses, broken down into:
Thanks to this, it is easy to assess the structure of inventory and the share of reserved items in relation to available stock.
Warehouse value - table
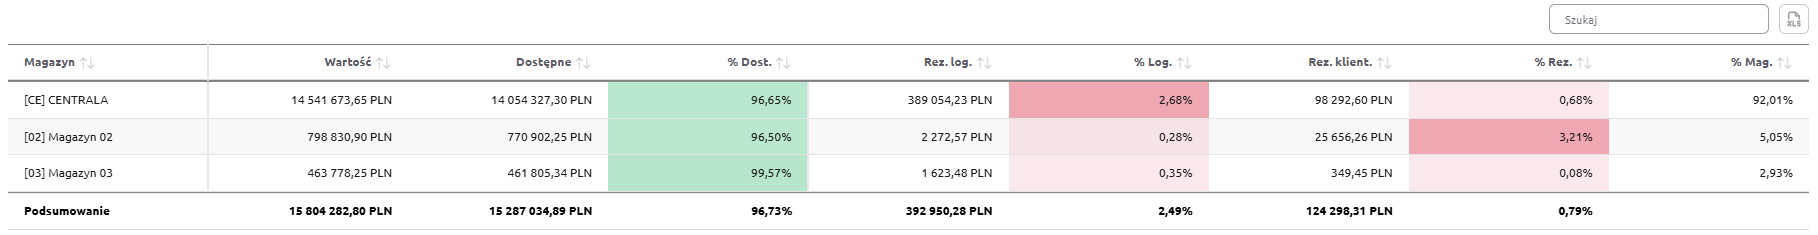
“Warehouse values” table – this summary presents the value of stock in individual warehouses, broken down into:
-
Total value,
-
Available value and its percentage share (% Avail.),
-
Logistics reservations value and its percentage share (% Log.),
-
Customer reservations value and its percentage share (% Cust. Res.),
-
Warehouse share in total stock (% Wh.).
The table uses color highlighting for easier interpretation:
-
Green – the more intense the color, the higher the share of goods available for sale,
-
Red – the more intense the color, the greater the share of goods blocked in logistics or customer reservations.
This allows the user to quickly assess not only numerical values but also the proportions between availability and reservations in each warehouse.
The table includes a search field that allows narrowing the view to selected warehouses. In such cases, the summaries automatically adjust to the filtered results.
Additionally, data can be sorted by clicking column headers – for example, to arrange warehouses by total value or reservation percentage.