
Monthly analysis
All values are calculated based on sales documents (WZ, PG, GP, ZW).
All values are converted to PLN according to the exchange rate of the previous day, ensuring consistent presentation regardless of the document currency.
Net sales in the month
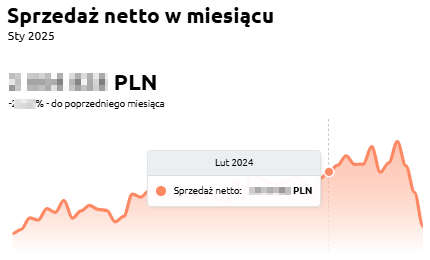
“Net sales in the month” – the chart presents the net sales value by month. It allows users to assess how sales have changed over time and compare results month by month.
The chart displays:
-
Net sales – the total sales value for the given month,
-
Timeline axis – enabling analysis of sales across consecutive months,
-
Difference from the previous month – indicating whether sales increased or decreased compared to the previous period.
Thanks to this chart, users can easily track monthly sales trends, quickly identifying periods of growth or decline, which helps in responding promptly to market changes.
Profit in the month
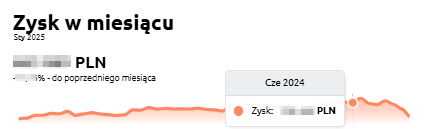
“Profit in the month” – the chart presents the financial result from sales by month. It allows users to assess how net profit evolved and how it changed from month to month.
The chart displays:
-
Profit in a given month – the difference between sales and costs,
-
Timeline axis – enabling analysis of profits over consecutive months,
-
Difference from the previous month – indicating whether profit increased or decreased compared to the earlier period.
Thanks to this chart, users can easily track monthly profitability trends and identify periods of higher or lower financial performance.
% Profit in the month
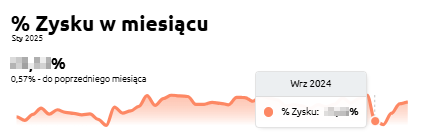
“% Profit in the month” – the chart presents the percentage profitability of sales by month. It allows users to assess how the net profit margin has evolved month by month.
The chart displays:
-
% Profit in a given month – the share of profit in total sales value,
-
Timeline axis – enabling analysis of profitability across consecutive months,
-
Difference from the previous month – showing whether profitability increased or decreased compared to the previous period.
Thanks to this chart, users can quickly verify whether the company maintains a stable profit margin or if there are visible fluctuations over time.
Profit – previous month
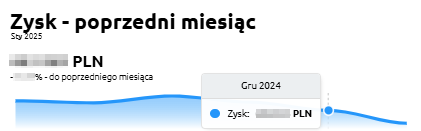
“Profit – previous month” – the chart presents the financial result from sales compared with the previous month. It allows users to see how profitability has changed month by month.
The chart displays:
-
Profit in a given month – the difference between sales and costs,
-
Timeline axis – showing profits across consecutive months,
-
Comparison with the previous month – indicating whether profit increased or decreased compared to the earlier period.
Thanks to this chart, users can quickly assess profitability trends and respond promptly to improvements or declines in financial performance.
% Profit – previous month
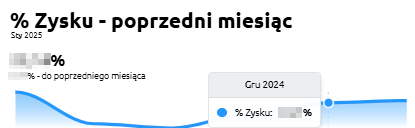
“% Profit – previous month” – the chart presents the percentage sales profitability compared with the previous month. It allows users to assess how the net profit margin has changed month by month.
The chart displays:
Thanks to this chart, users can quickly check whether the company maintains stable sales profitability or experiences noticeable month-to-month fluctuations.
Net sales – previous month
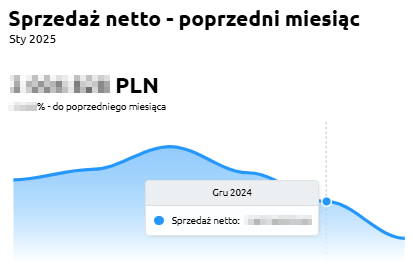
“Net sales – previous month” – the chart presents the net sales value compared with the previous month. It allows users to assess how sales have changed month by month.
The chart displays:
-
Net sales in a given month – the total sales value,
-
Timeline axis – showing sales across consecutive months,
-
Comparison with the previous month – indicating whether sales increased or decreased compared to the earlier period.
Thanks to this chart, users can quickly see the trend in net sales and determine whether the company maintains steady growth or experiences declines.
Sales by months
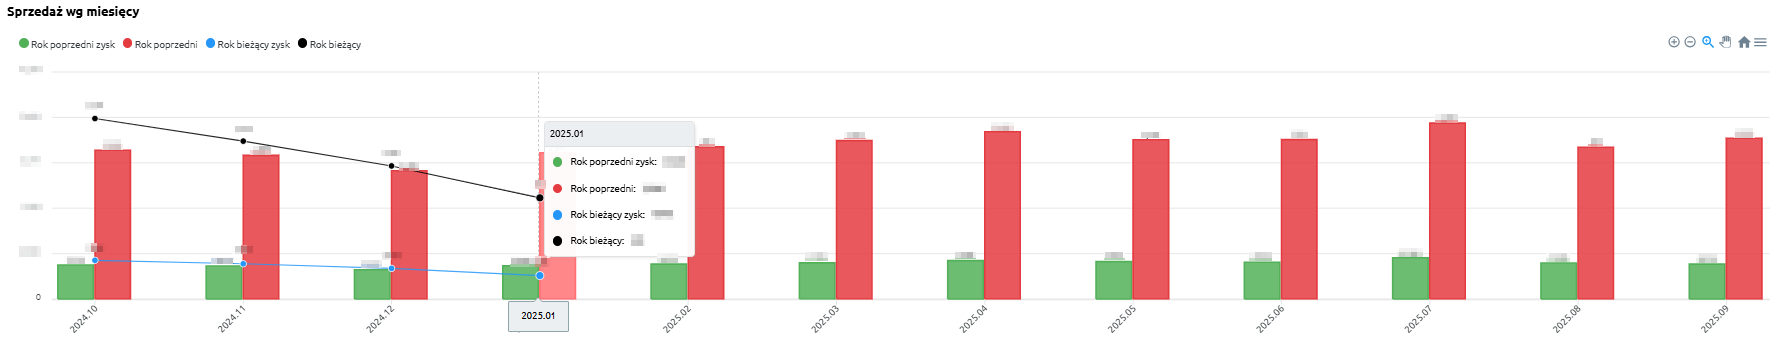
“Sales by months” – the chart presents the sales value and profit on a monthly basis, divided into the current year and the previous year. This makes it possible to compare how results have developed across the same months in two different periods.
The chart displays:
-
Previous year (red) – sales values for each month of the previous year,
-
Previous year profit (green) – profit achieved in each month of the previous year,
-
Current year (black) – sales values for each month of the current year,
-
Current year profit (blue) – profit achieved in each month of the current year.
Thanks to this chart, users can easily analyze changes in sales and profit over time and compare whether the current year performs better, worse, or similarly to the previous one across individual months.