
Purchases by contractors
All values are calculated based on purchase documents (PZ, P-).
All values are converted to PLN according to the exchange rate of the previous day, ensuring a consistent presentation regardless of the document currency.
Purchases by contractors
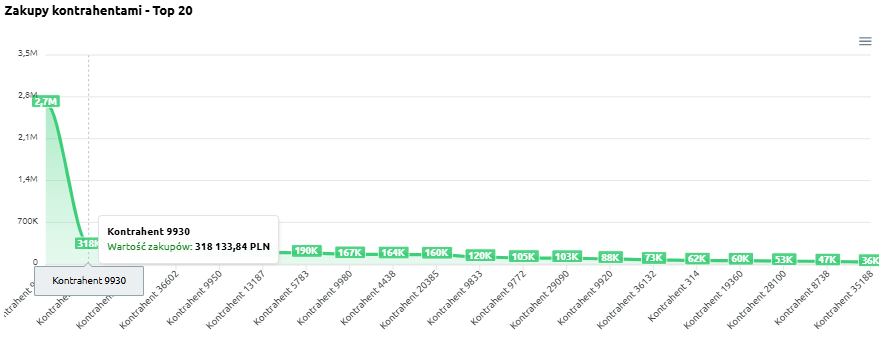
“Purchases by contractors – Top 20” – the chart presents the 20 contractors with the highest purchase value. It allows users to identify which suppliers play a key role in the company’s purchasing structure.
The chart displays:
-
Purchase value (green) – total expenditure with each contractor,
-
X-axis – individual contractors,
-
Y-axis – purchase values.
Thanks to this chart, users can easily assess which contractors generate the highest purchasing costs and compare how spending is distributed among the company’s main suppliers.
Purchases by contractors – Top 500
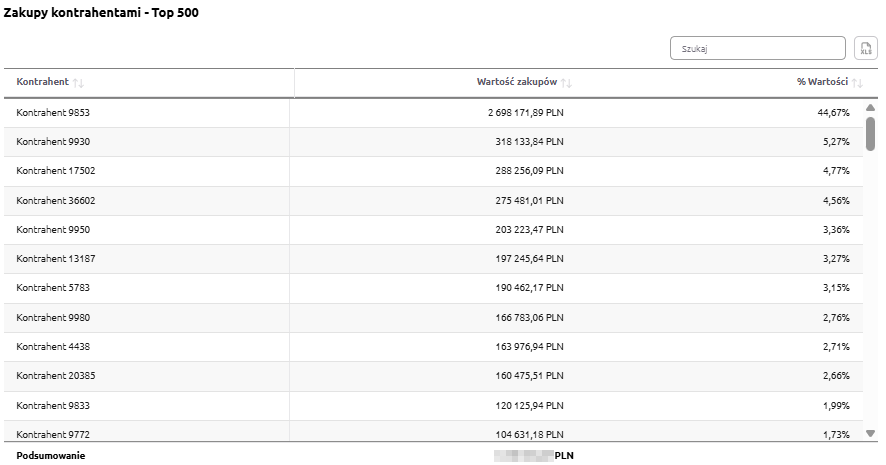
“Purchases by contractors – Top 500” – the table presents a summary of contractors with the highest purchase values. It allows users to identify which suppliers account for the largest share of company expenses and how the purchase structure is distributed.
The table includes the following fields:
-
Contractor – name of the contractor,
-
Purchase value – total expenditure with the given contractor,
-
% Value – the contractor’s percentage share in total purchase value.
The table includes a search field, allowing users to narrow the data to selected contractors. In such cases, summaries automatically adjust to the filtered results.
Additionally, data can be sorted by clicking column headers – for example, to arrange contractors by purchase value or percentage share.
Thanks to this table, users can easily identify the company’s key suppliers and understand their share in overall purchasing costs.